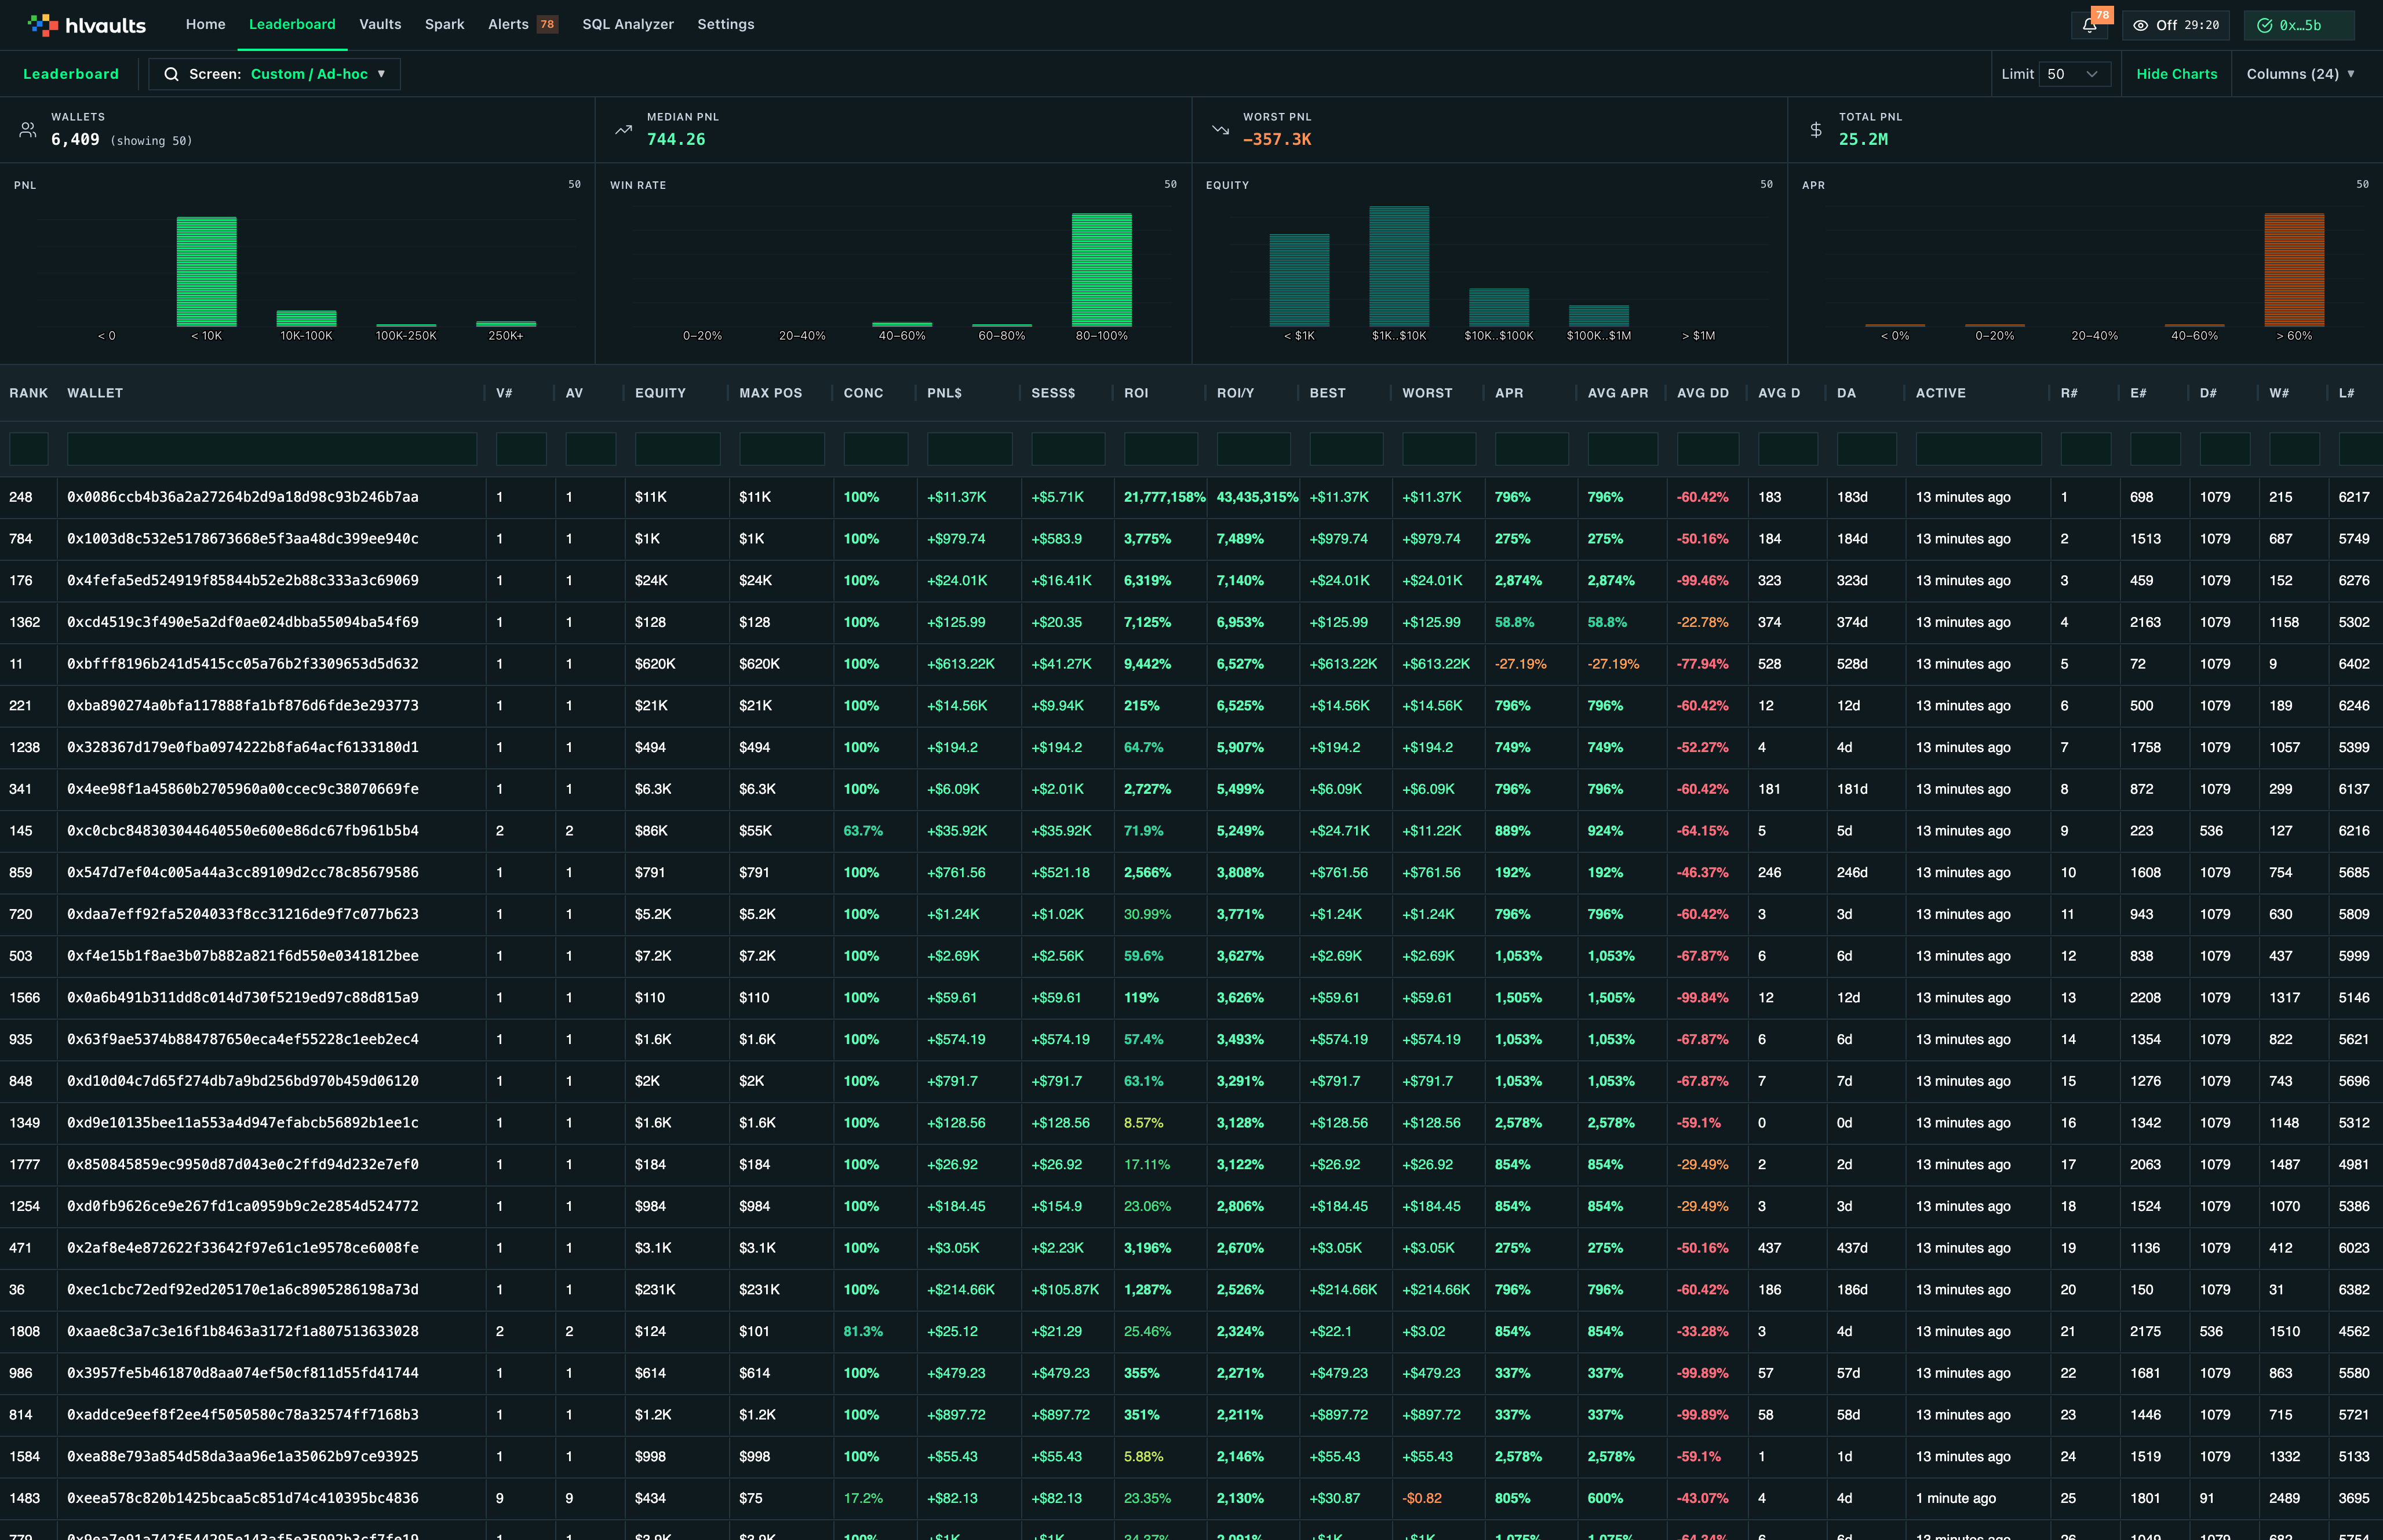
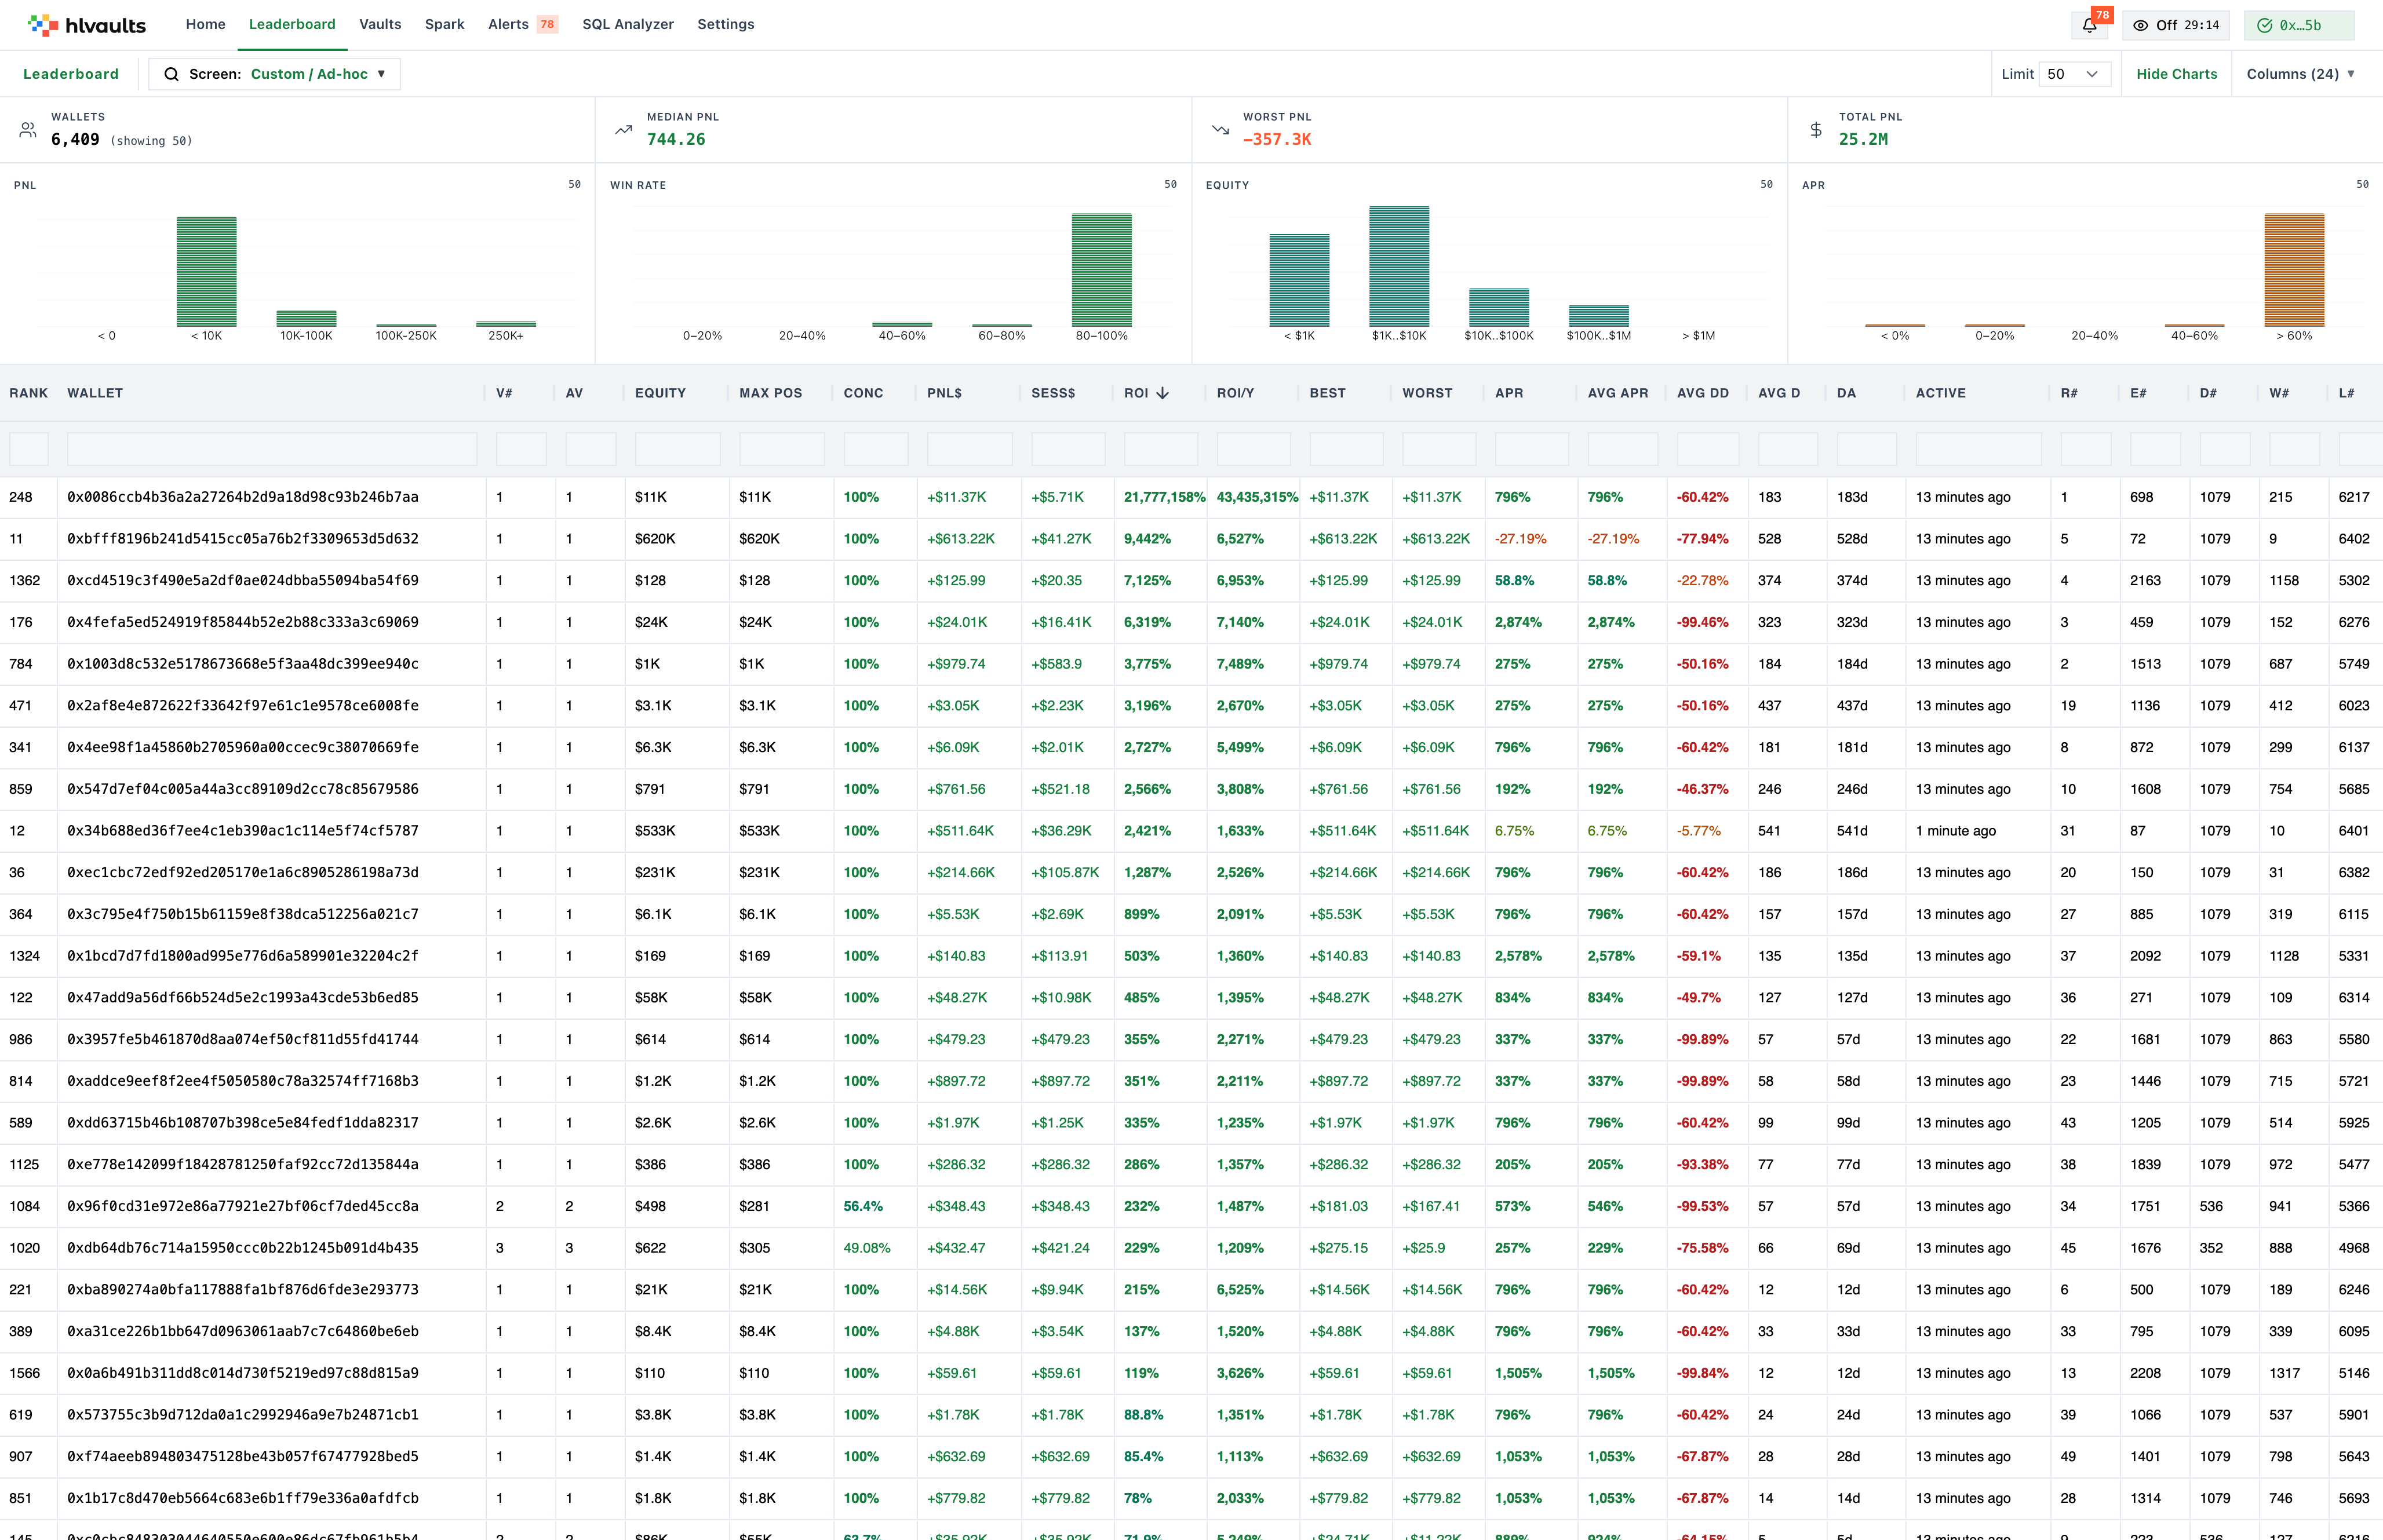
Leaderboard Columns
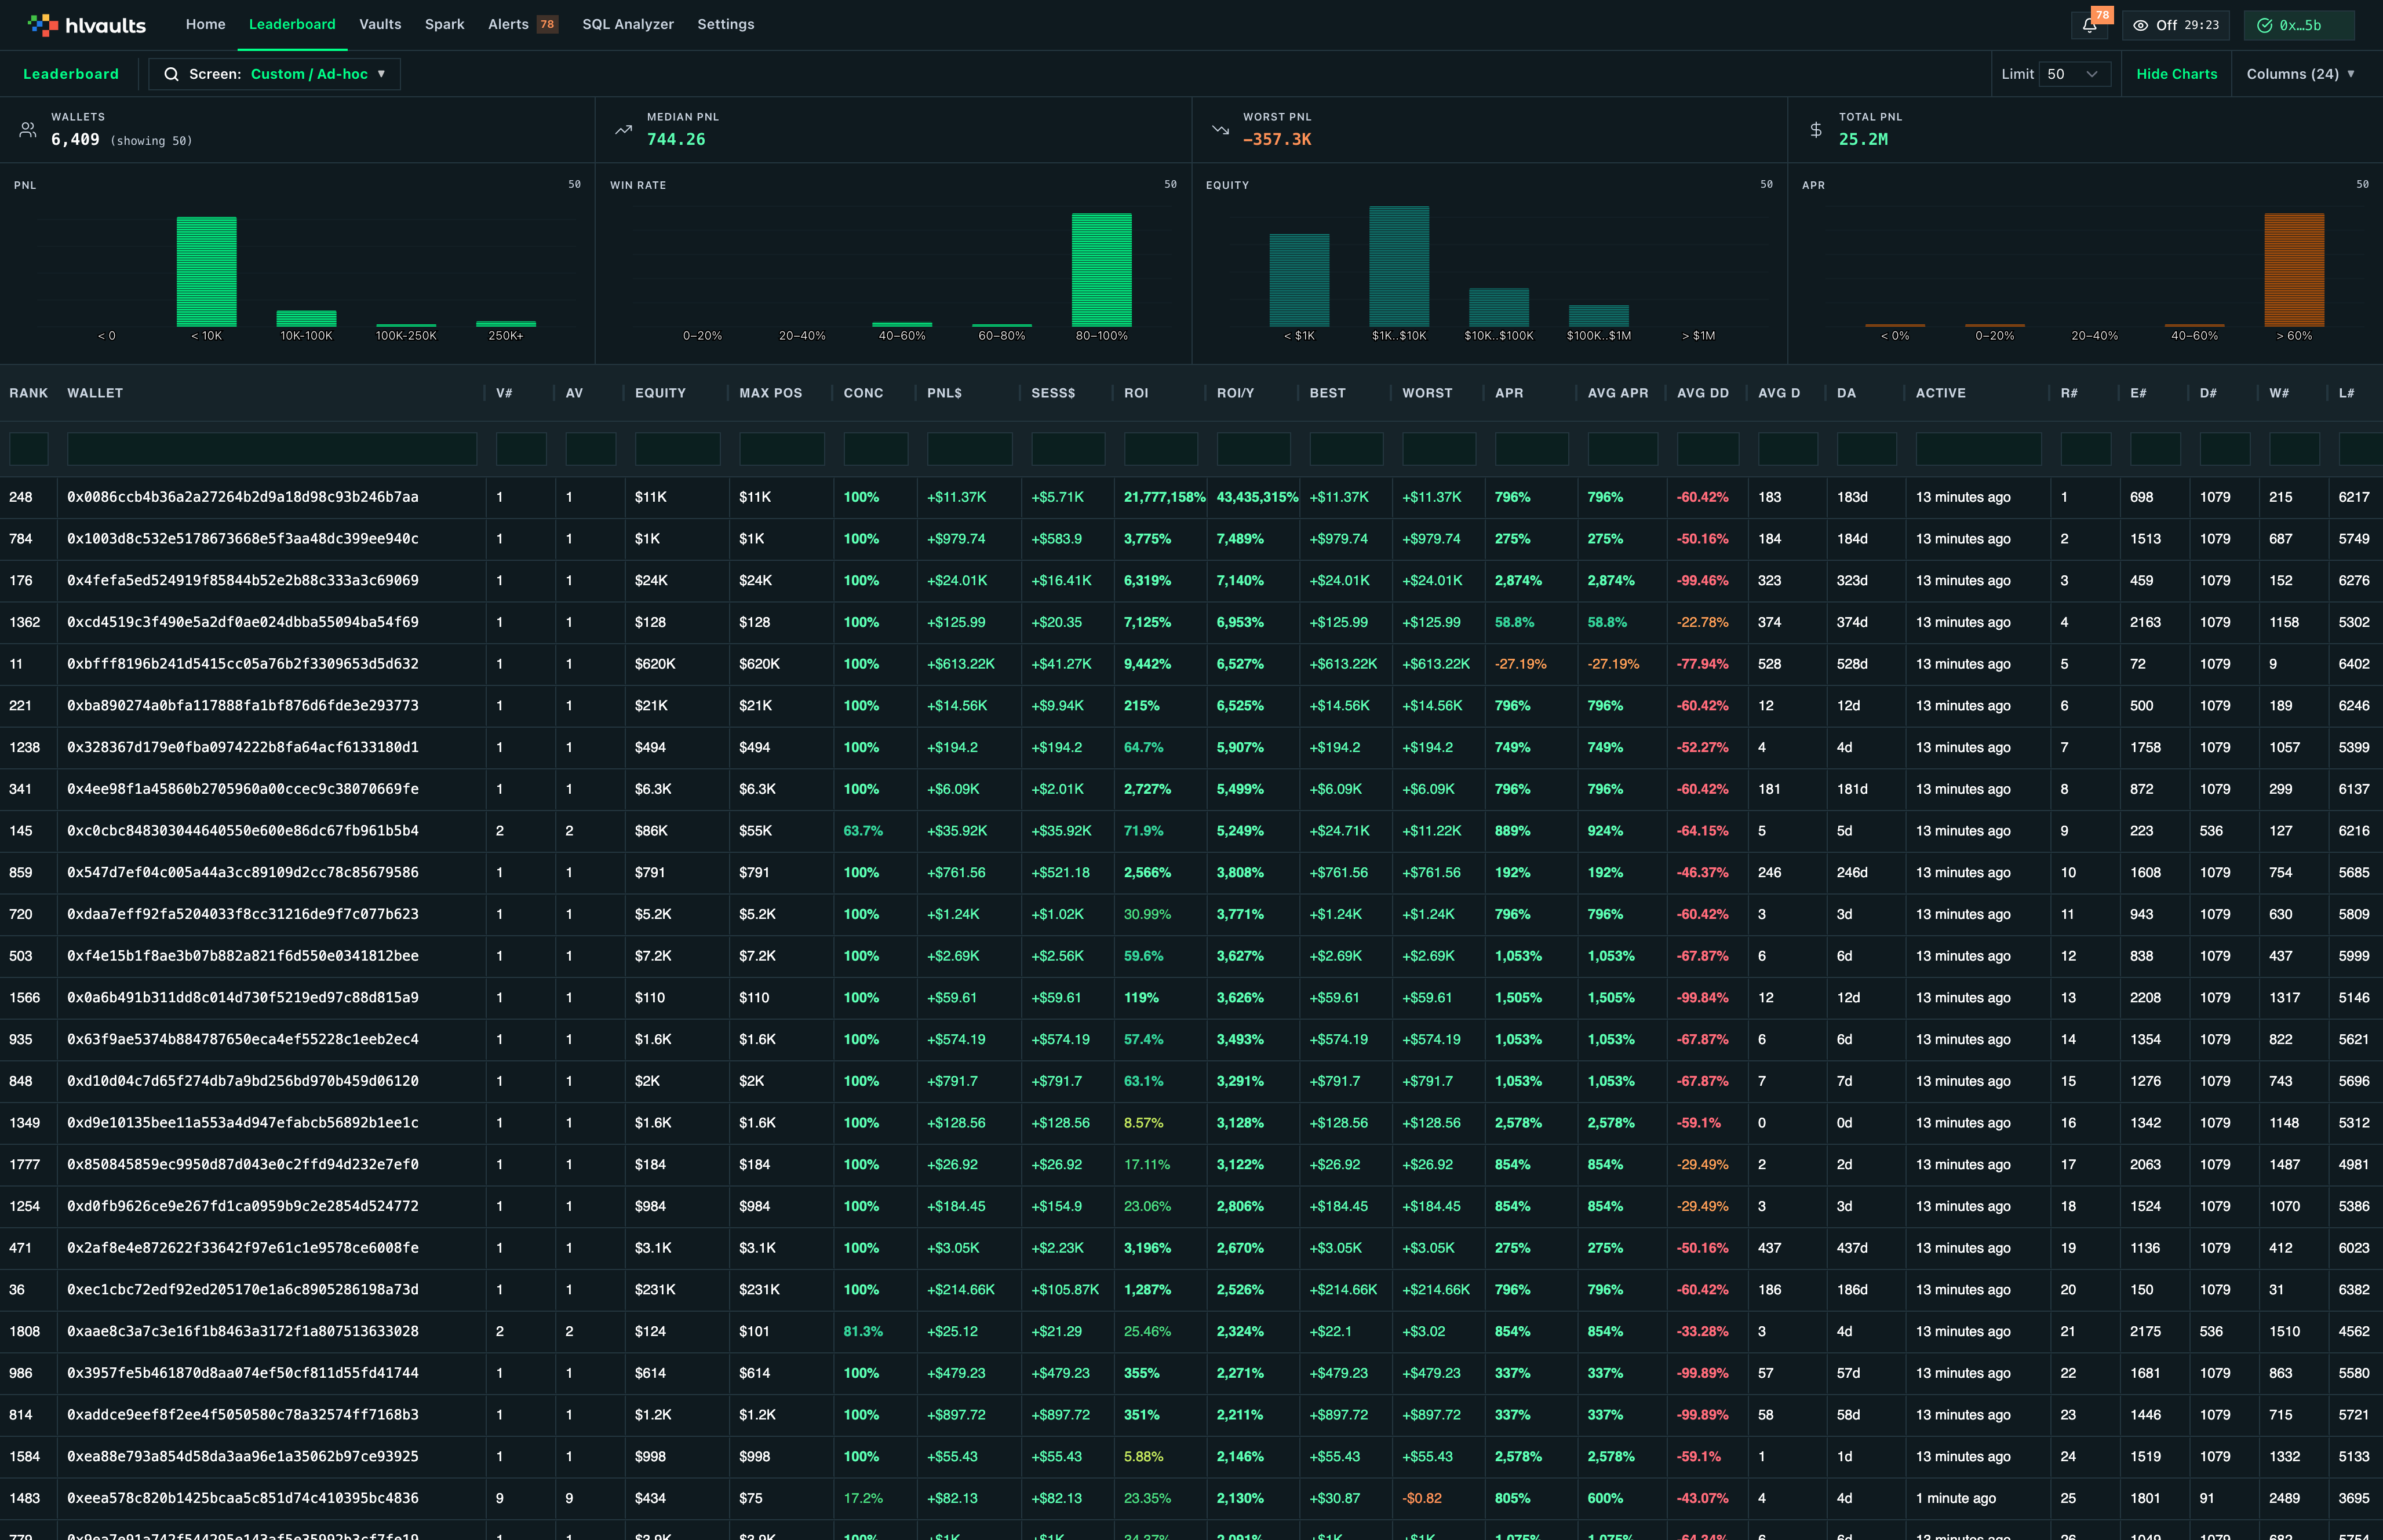
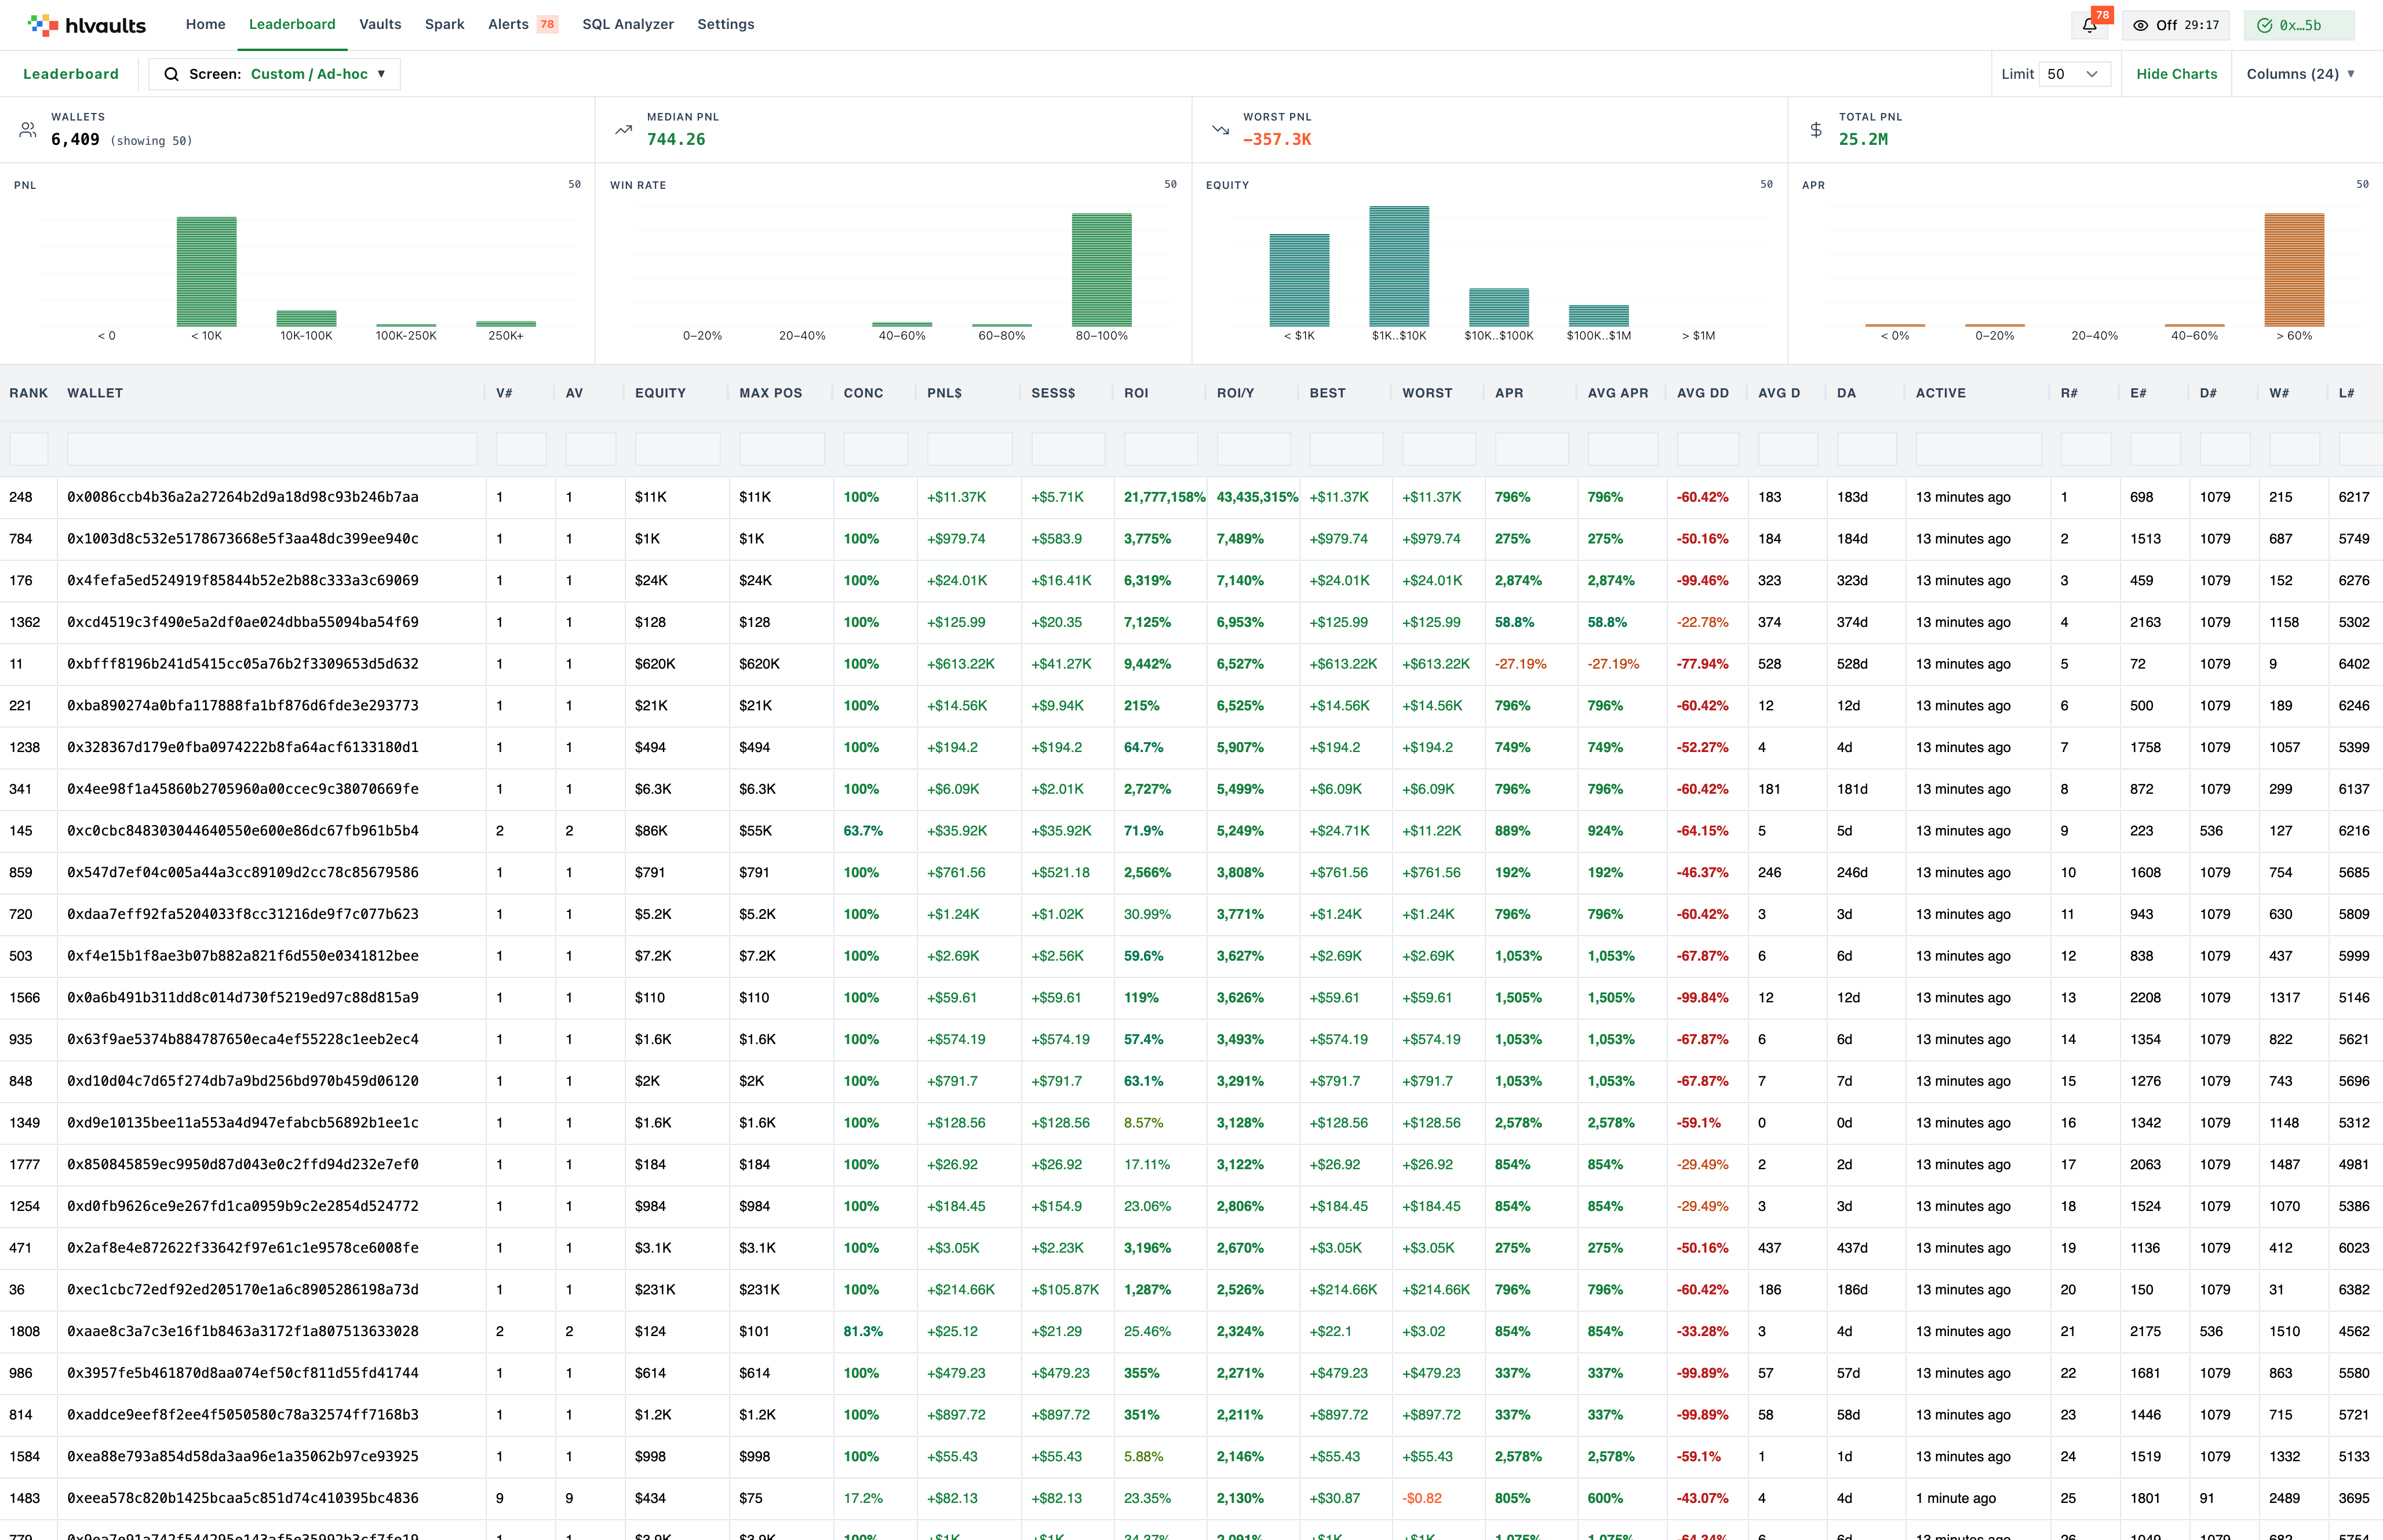
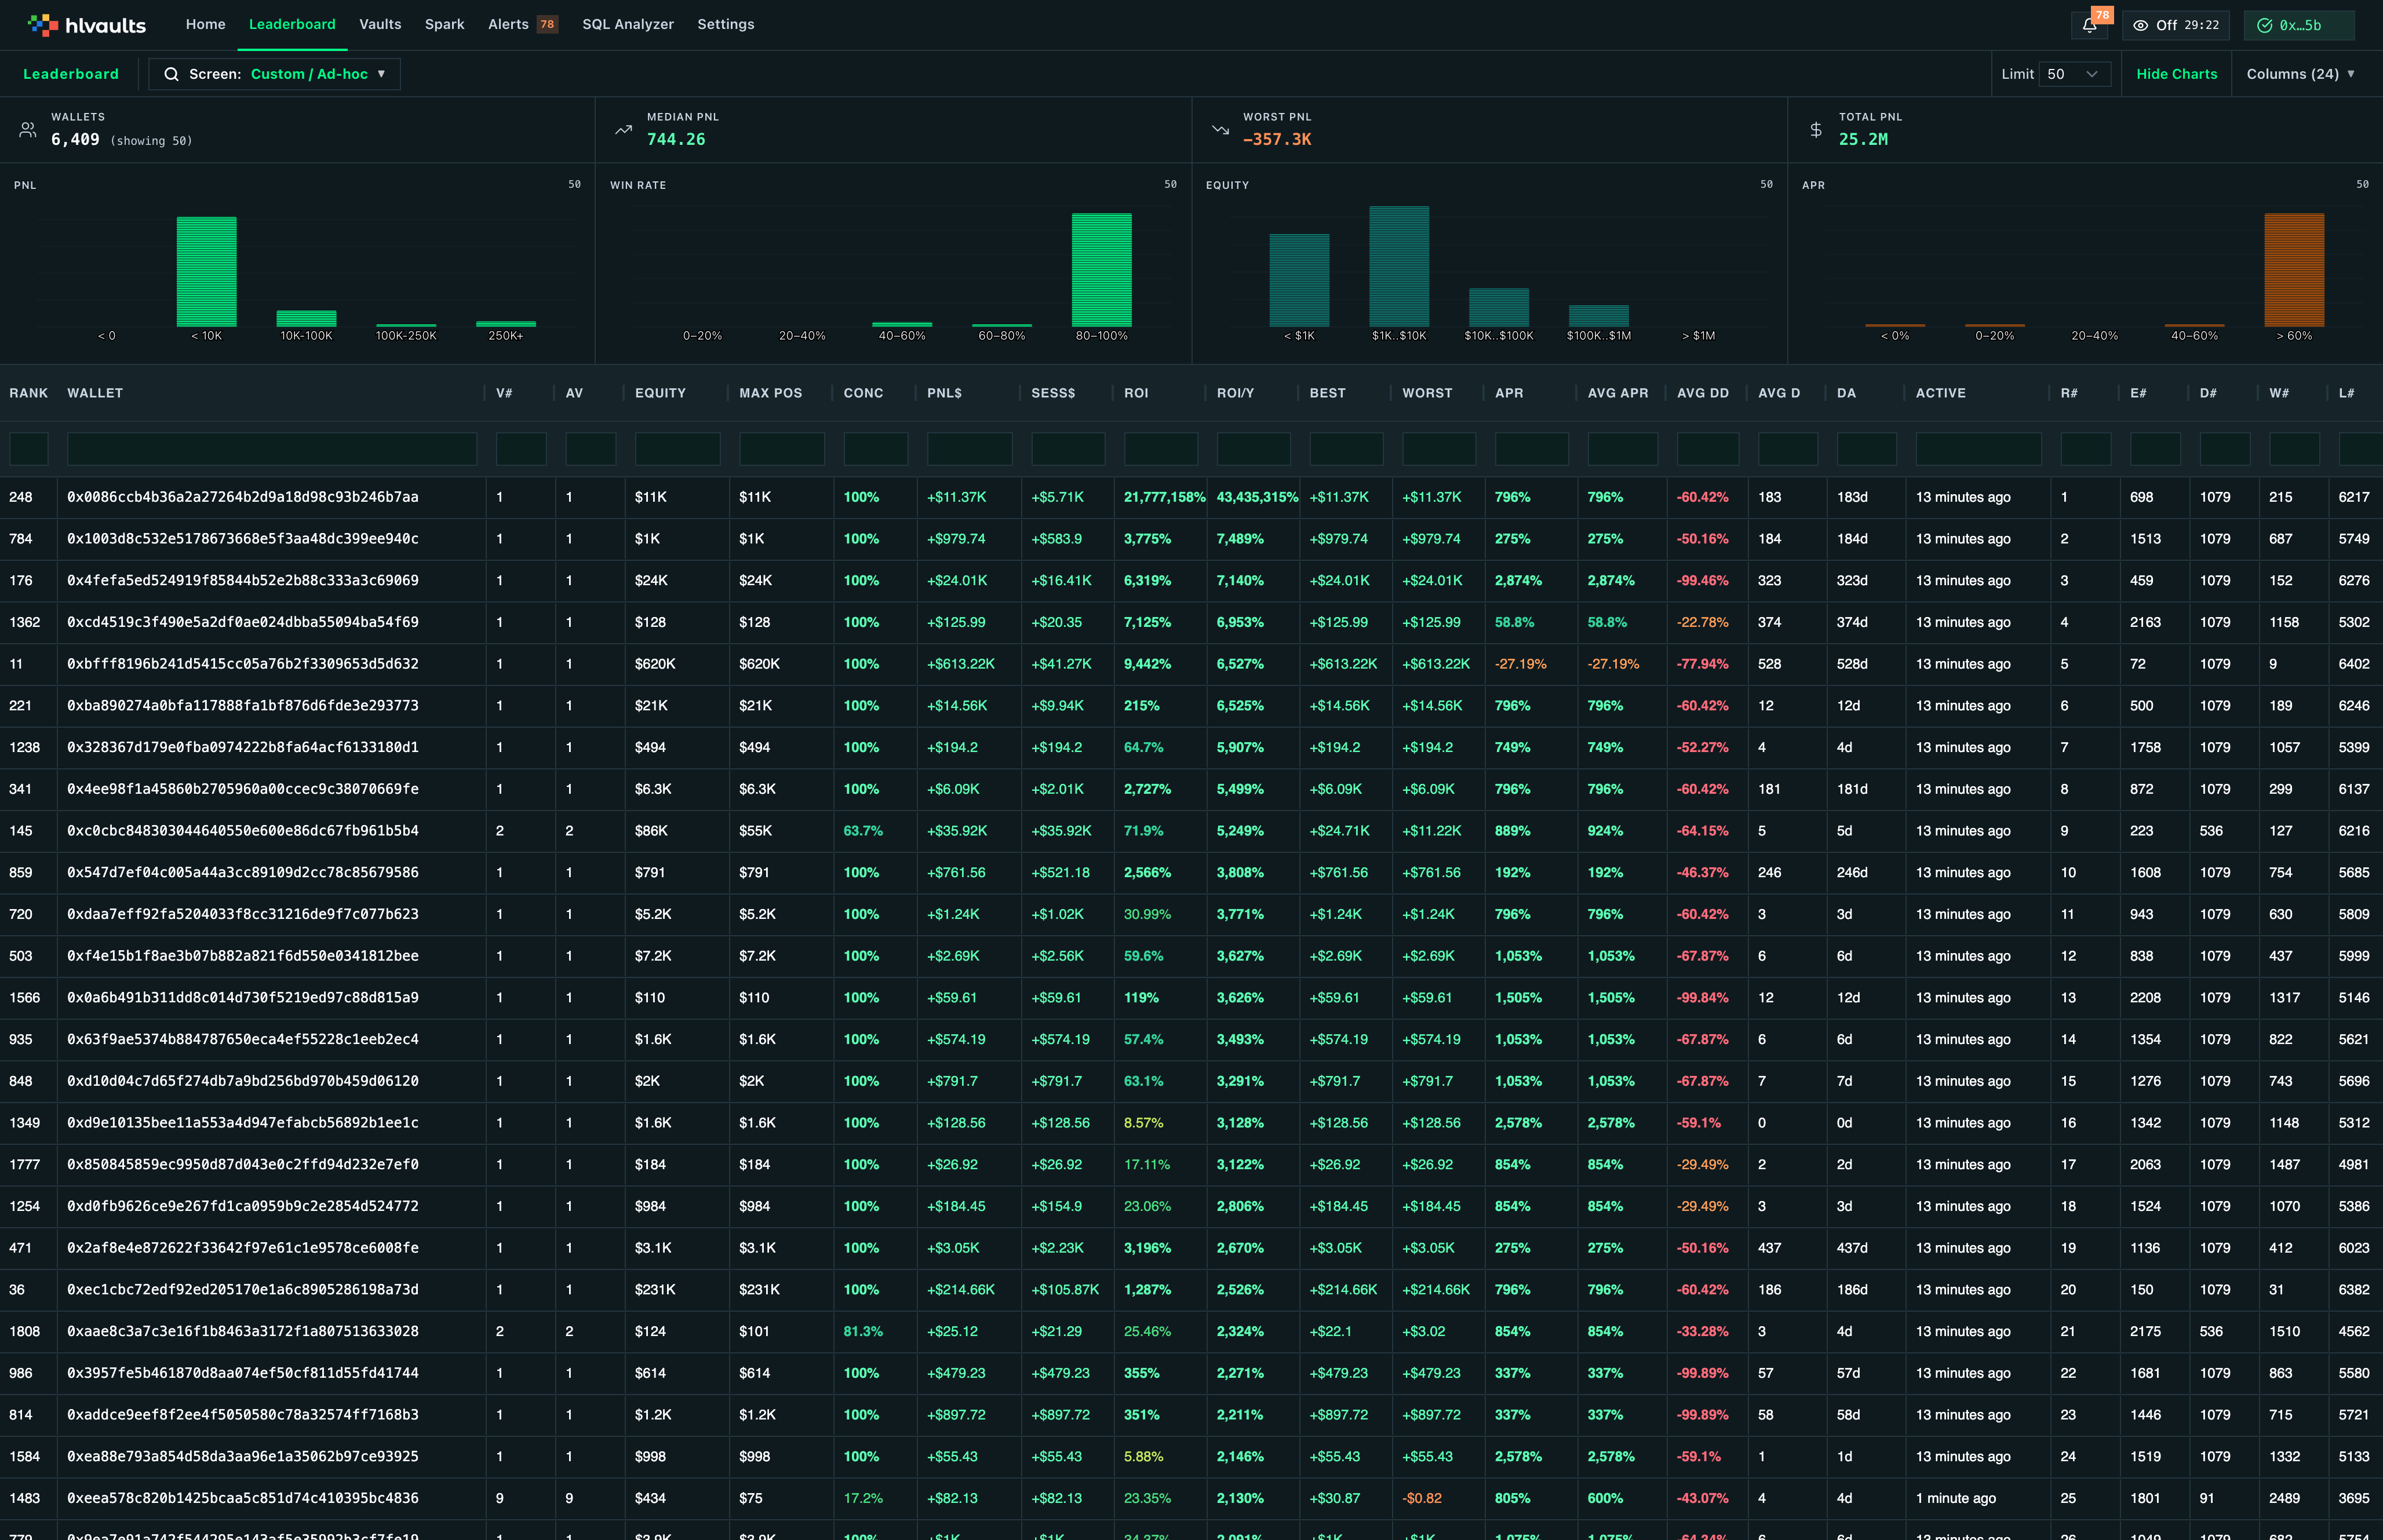
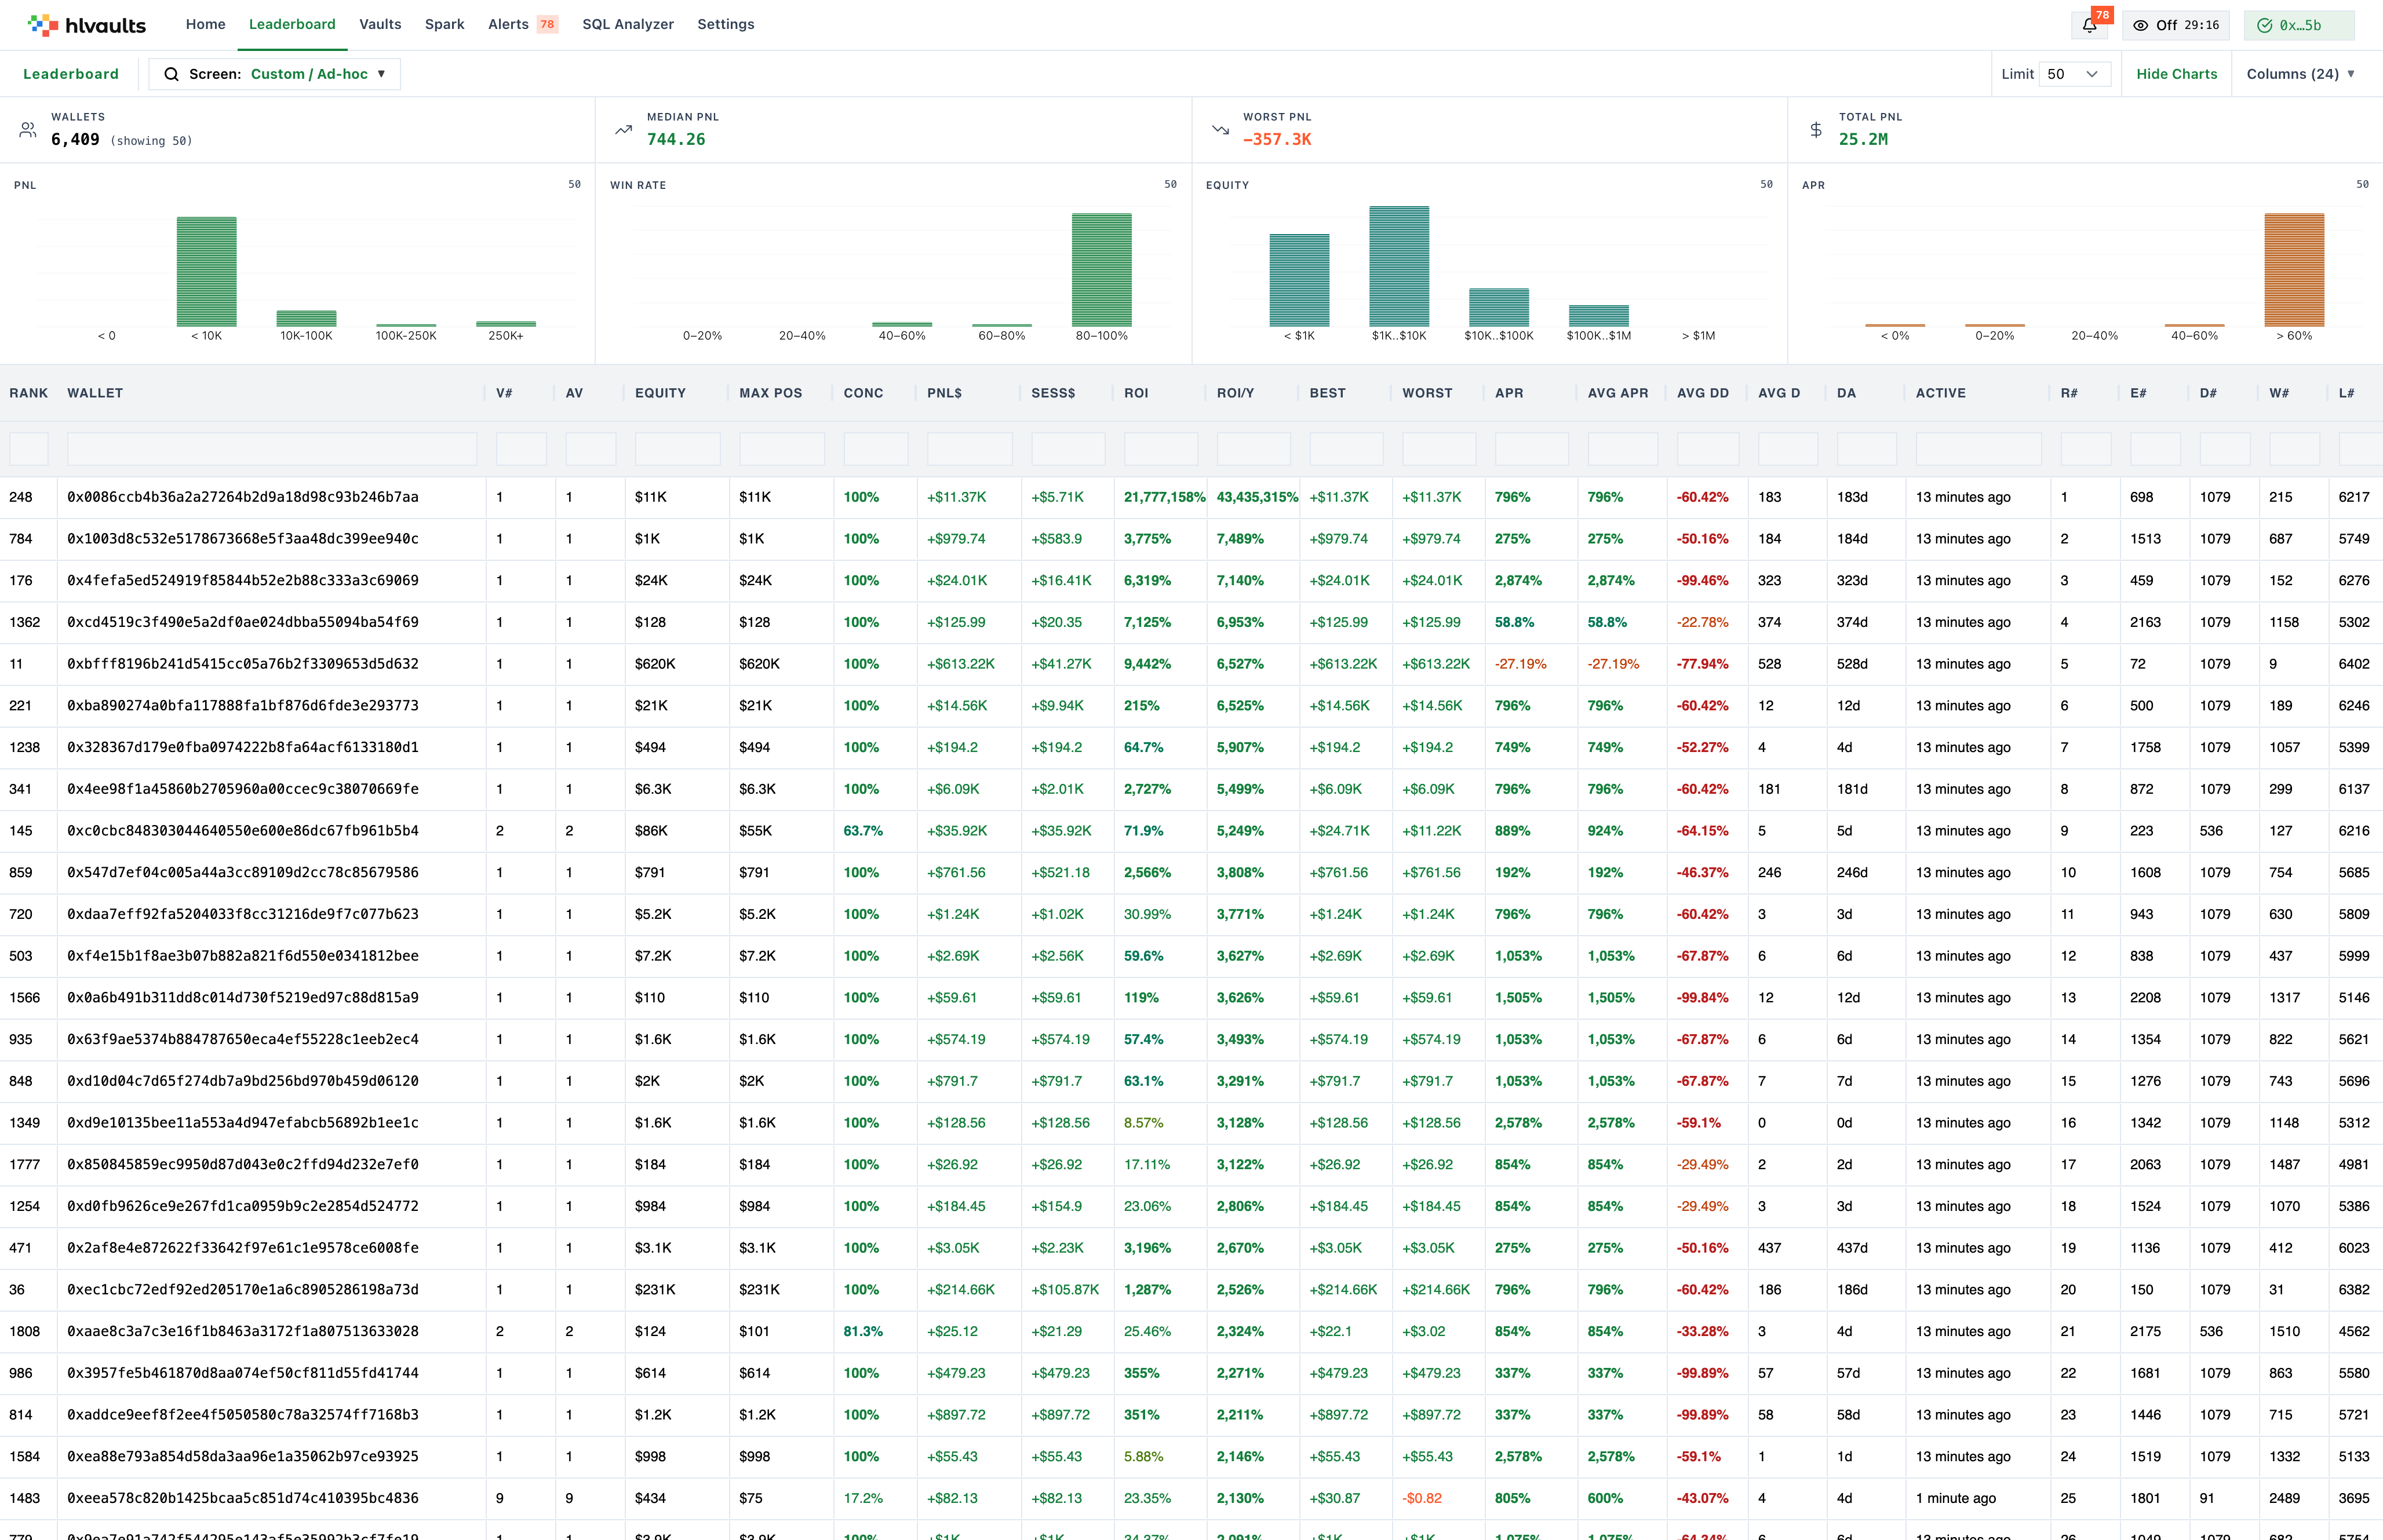
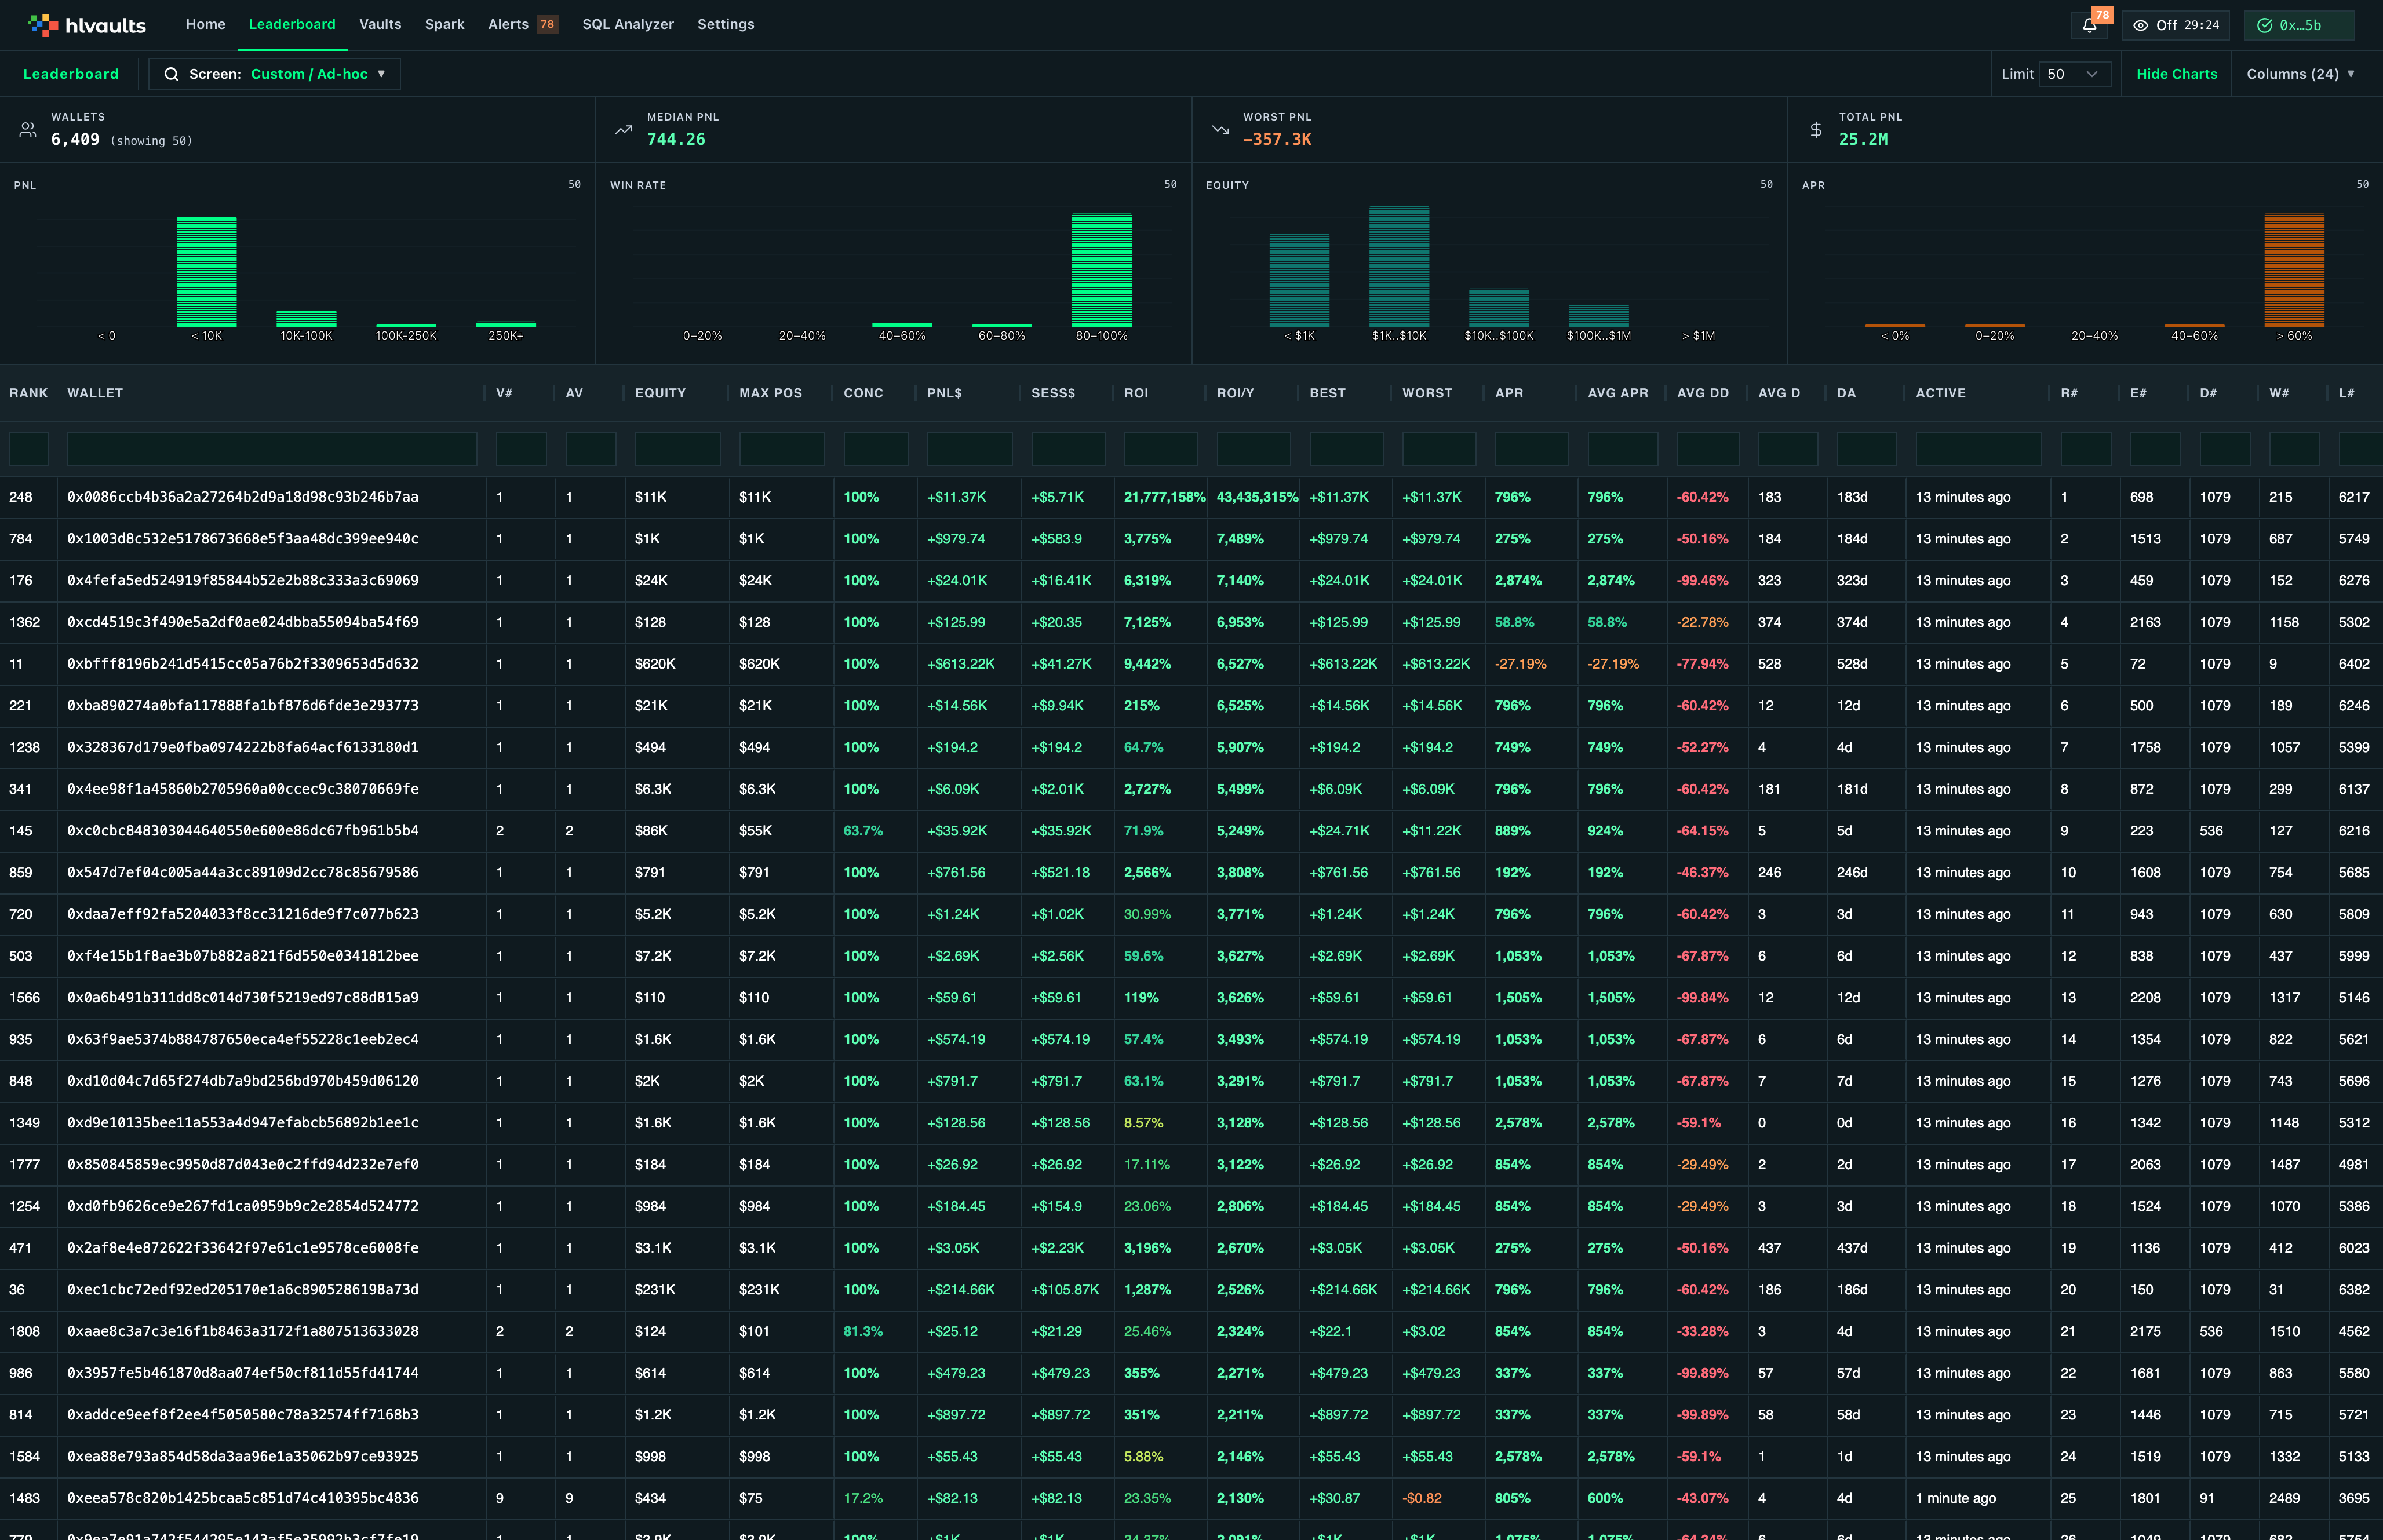
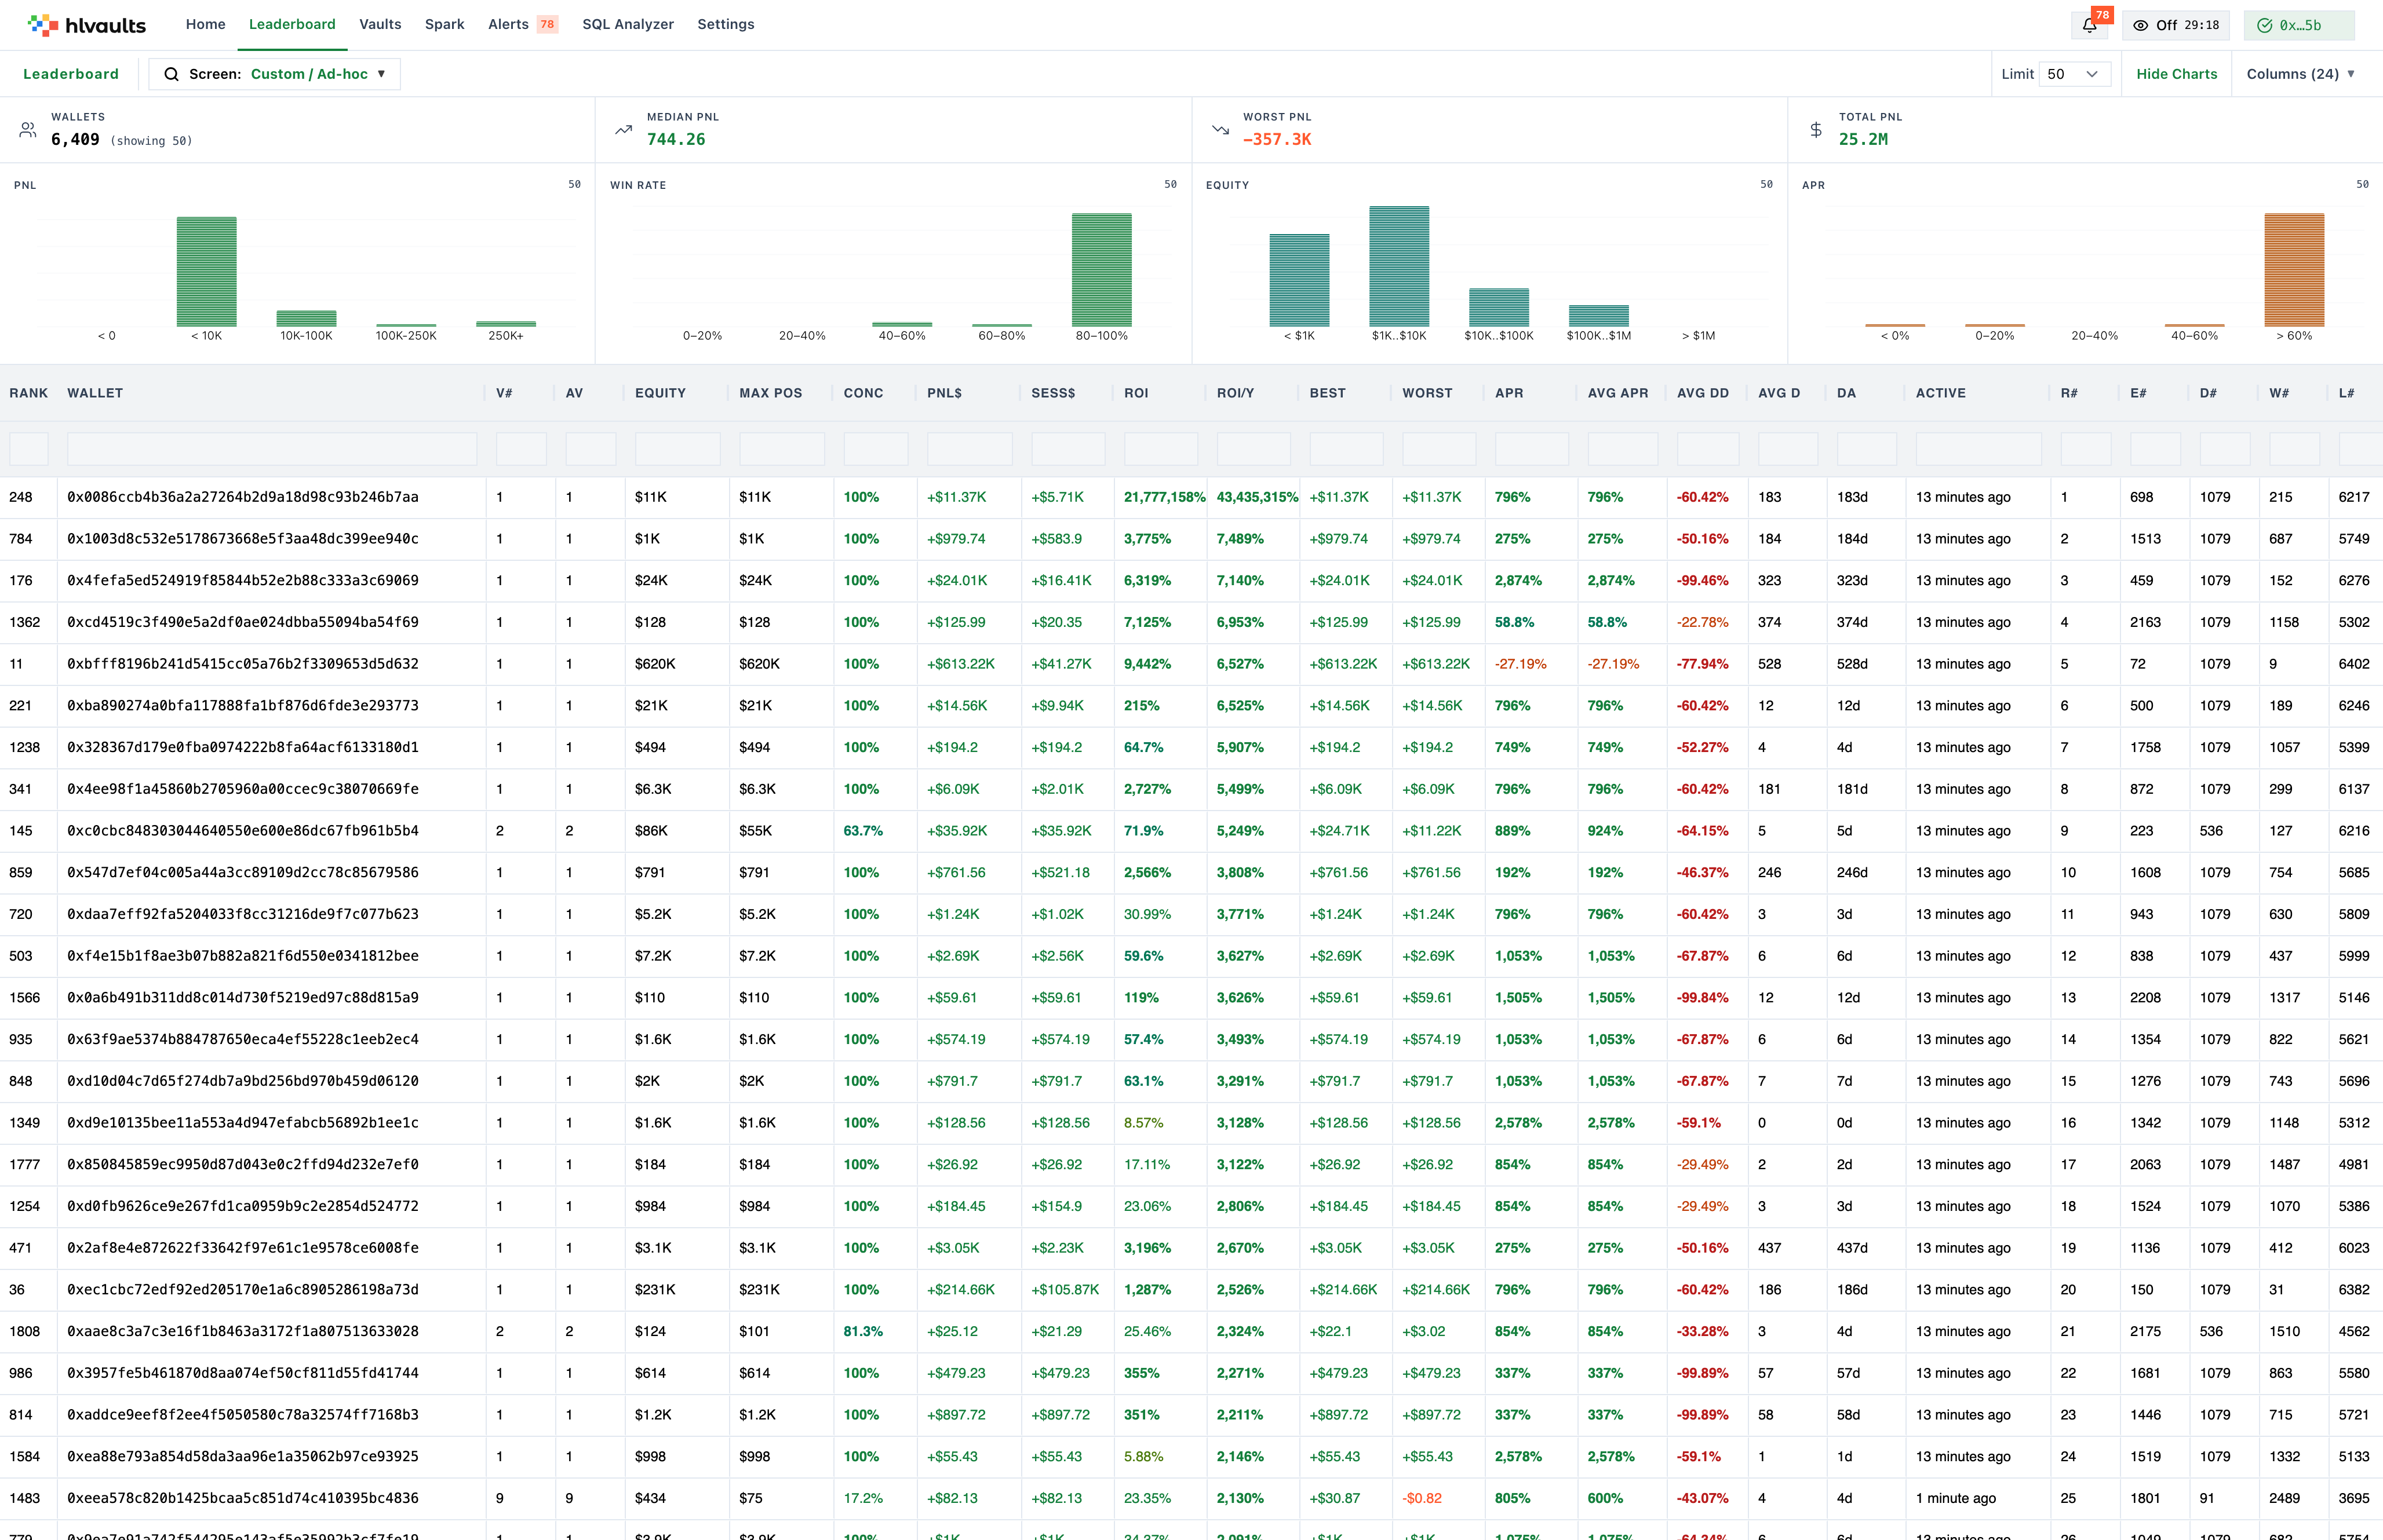
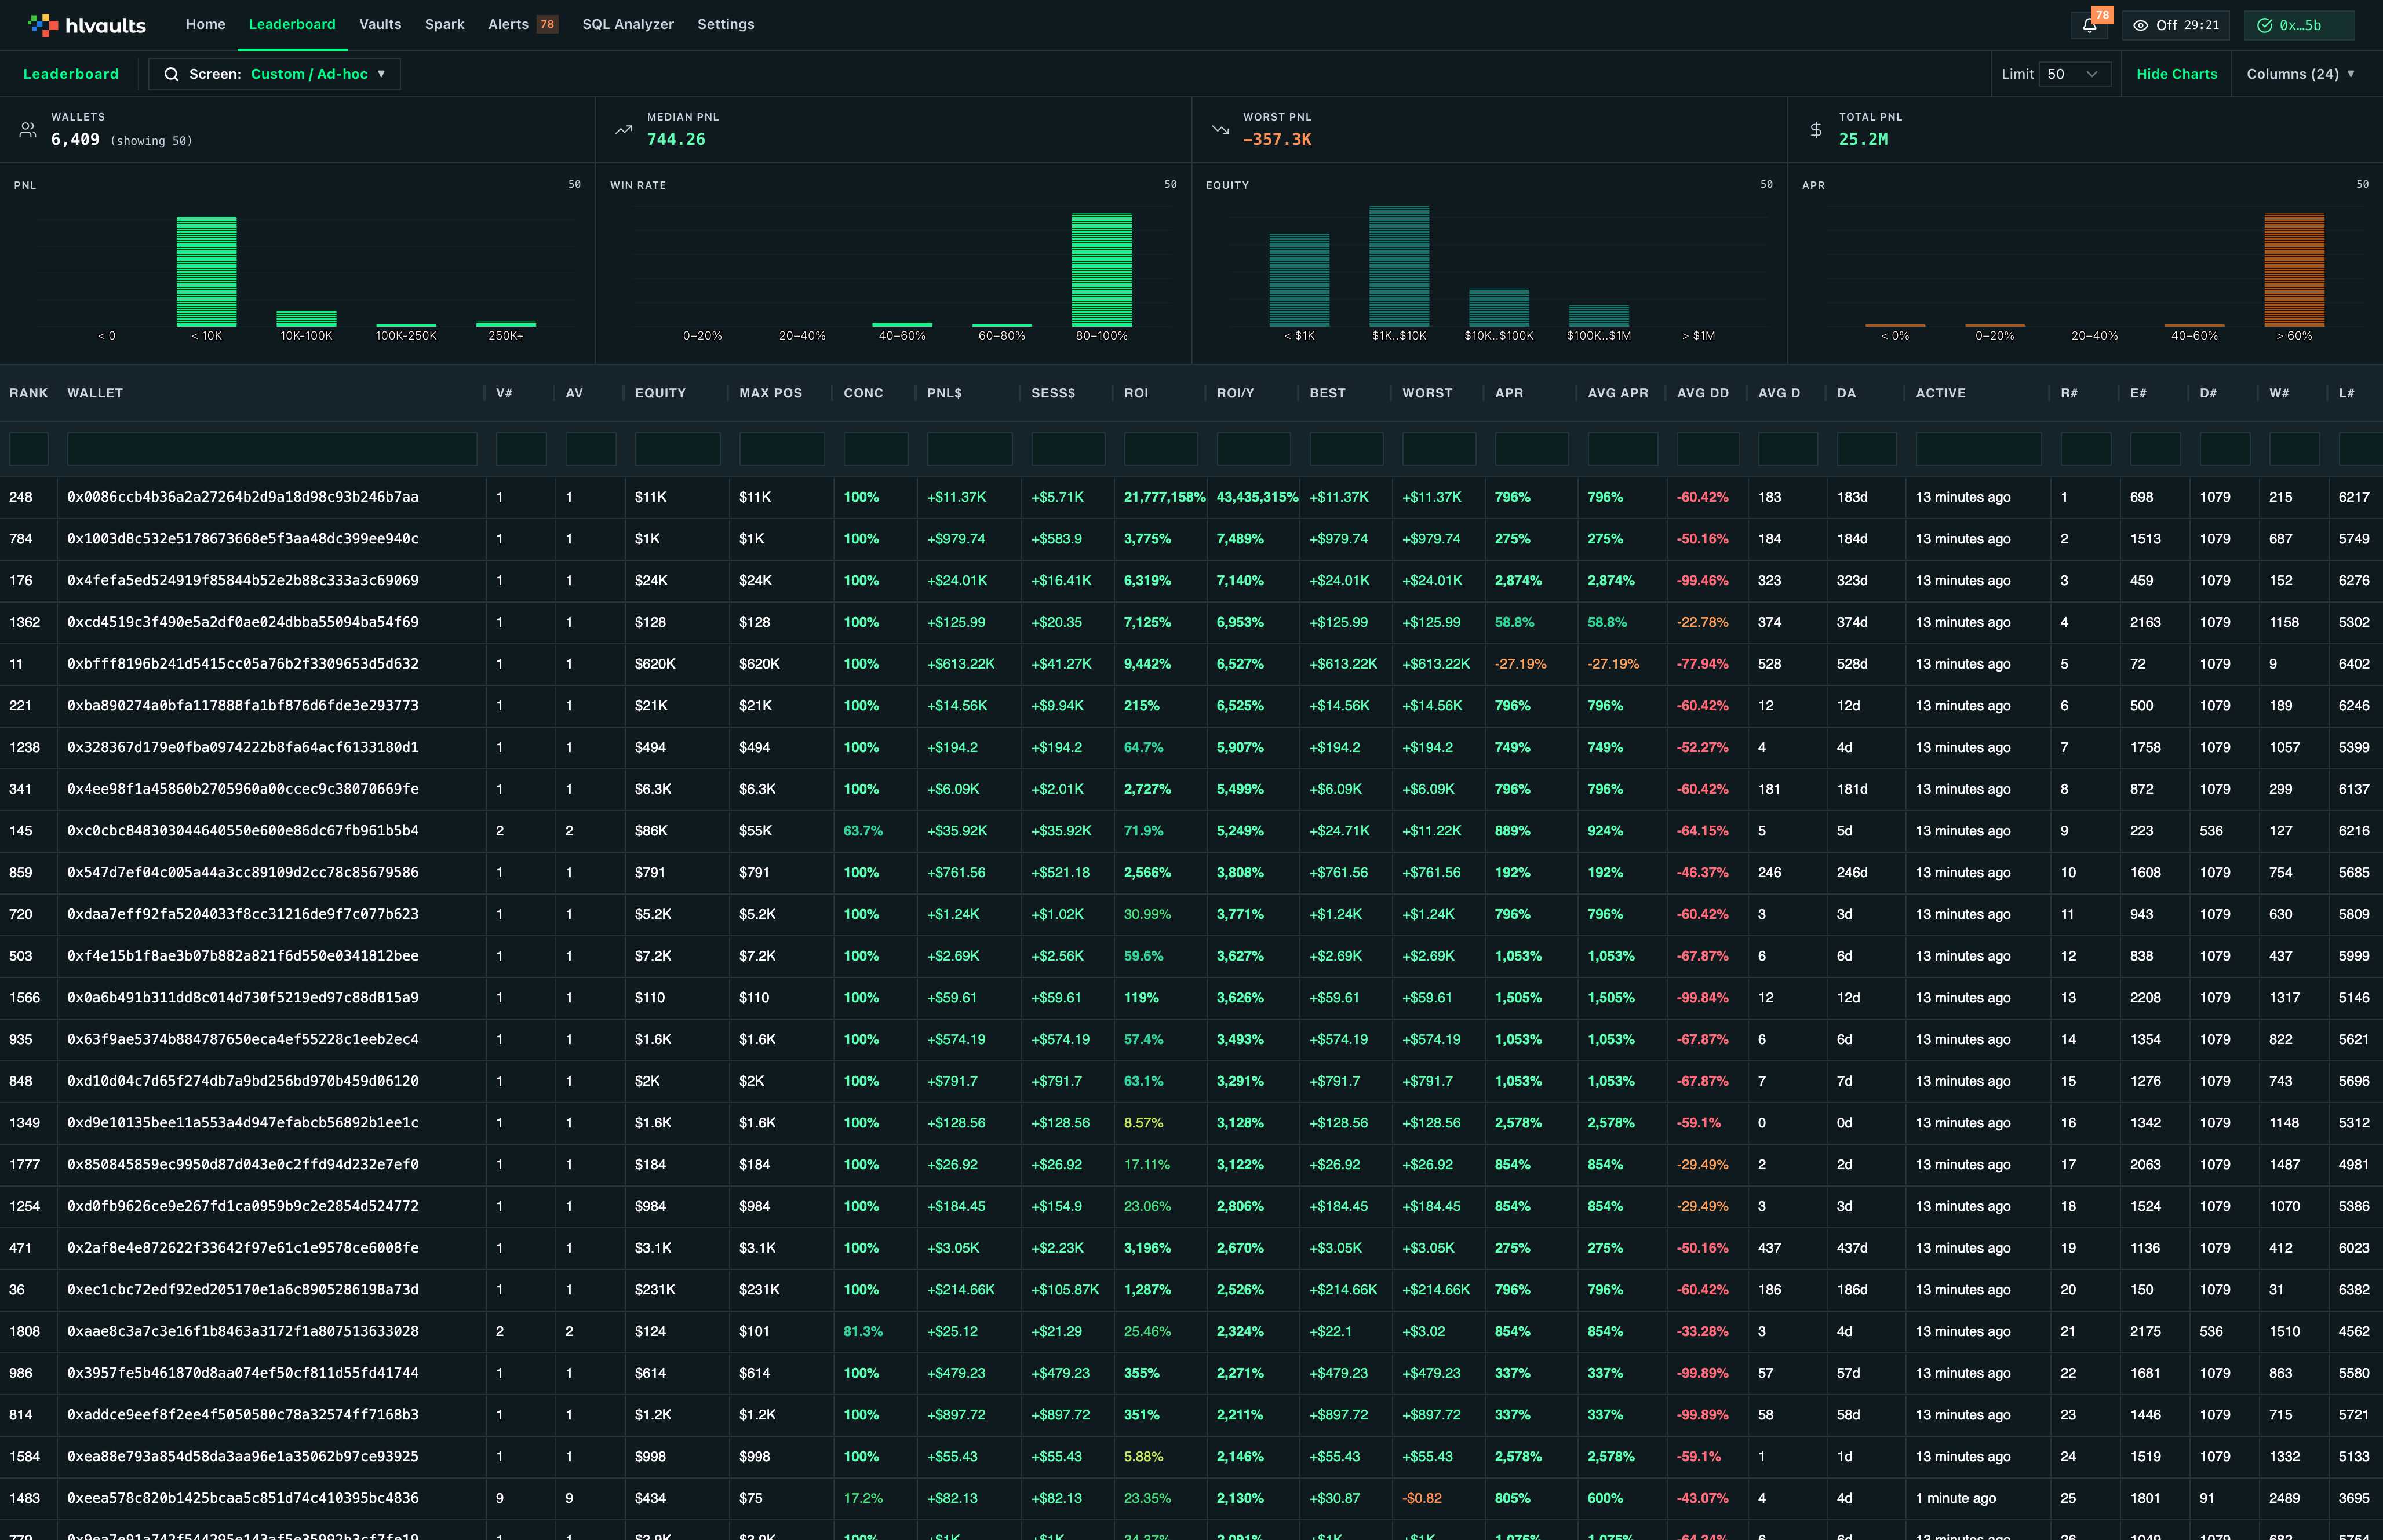
The leaderboard has 35 columns across 6 categories. They measure wallet-level (not vault-level) performance.
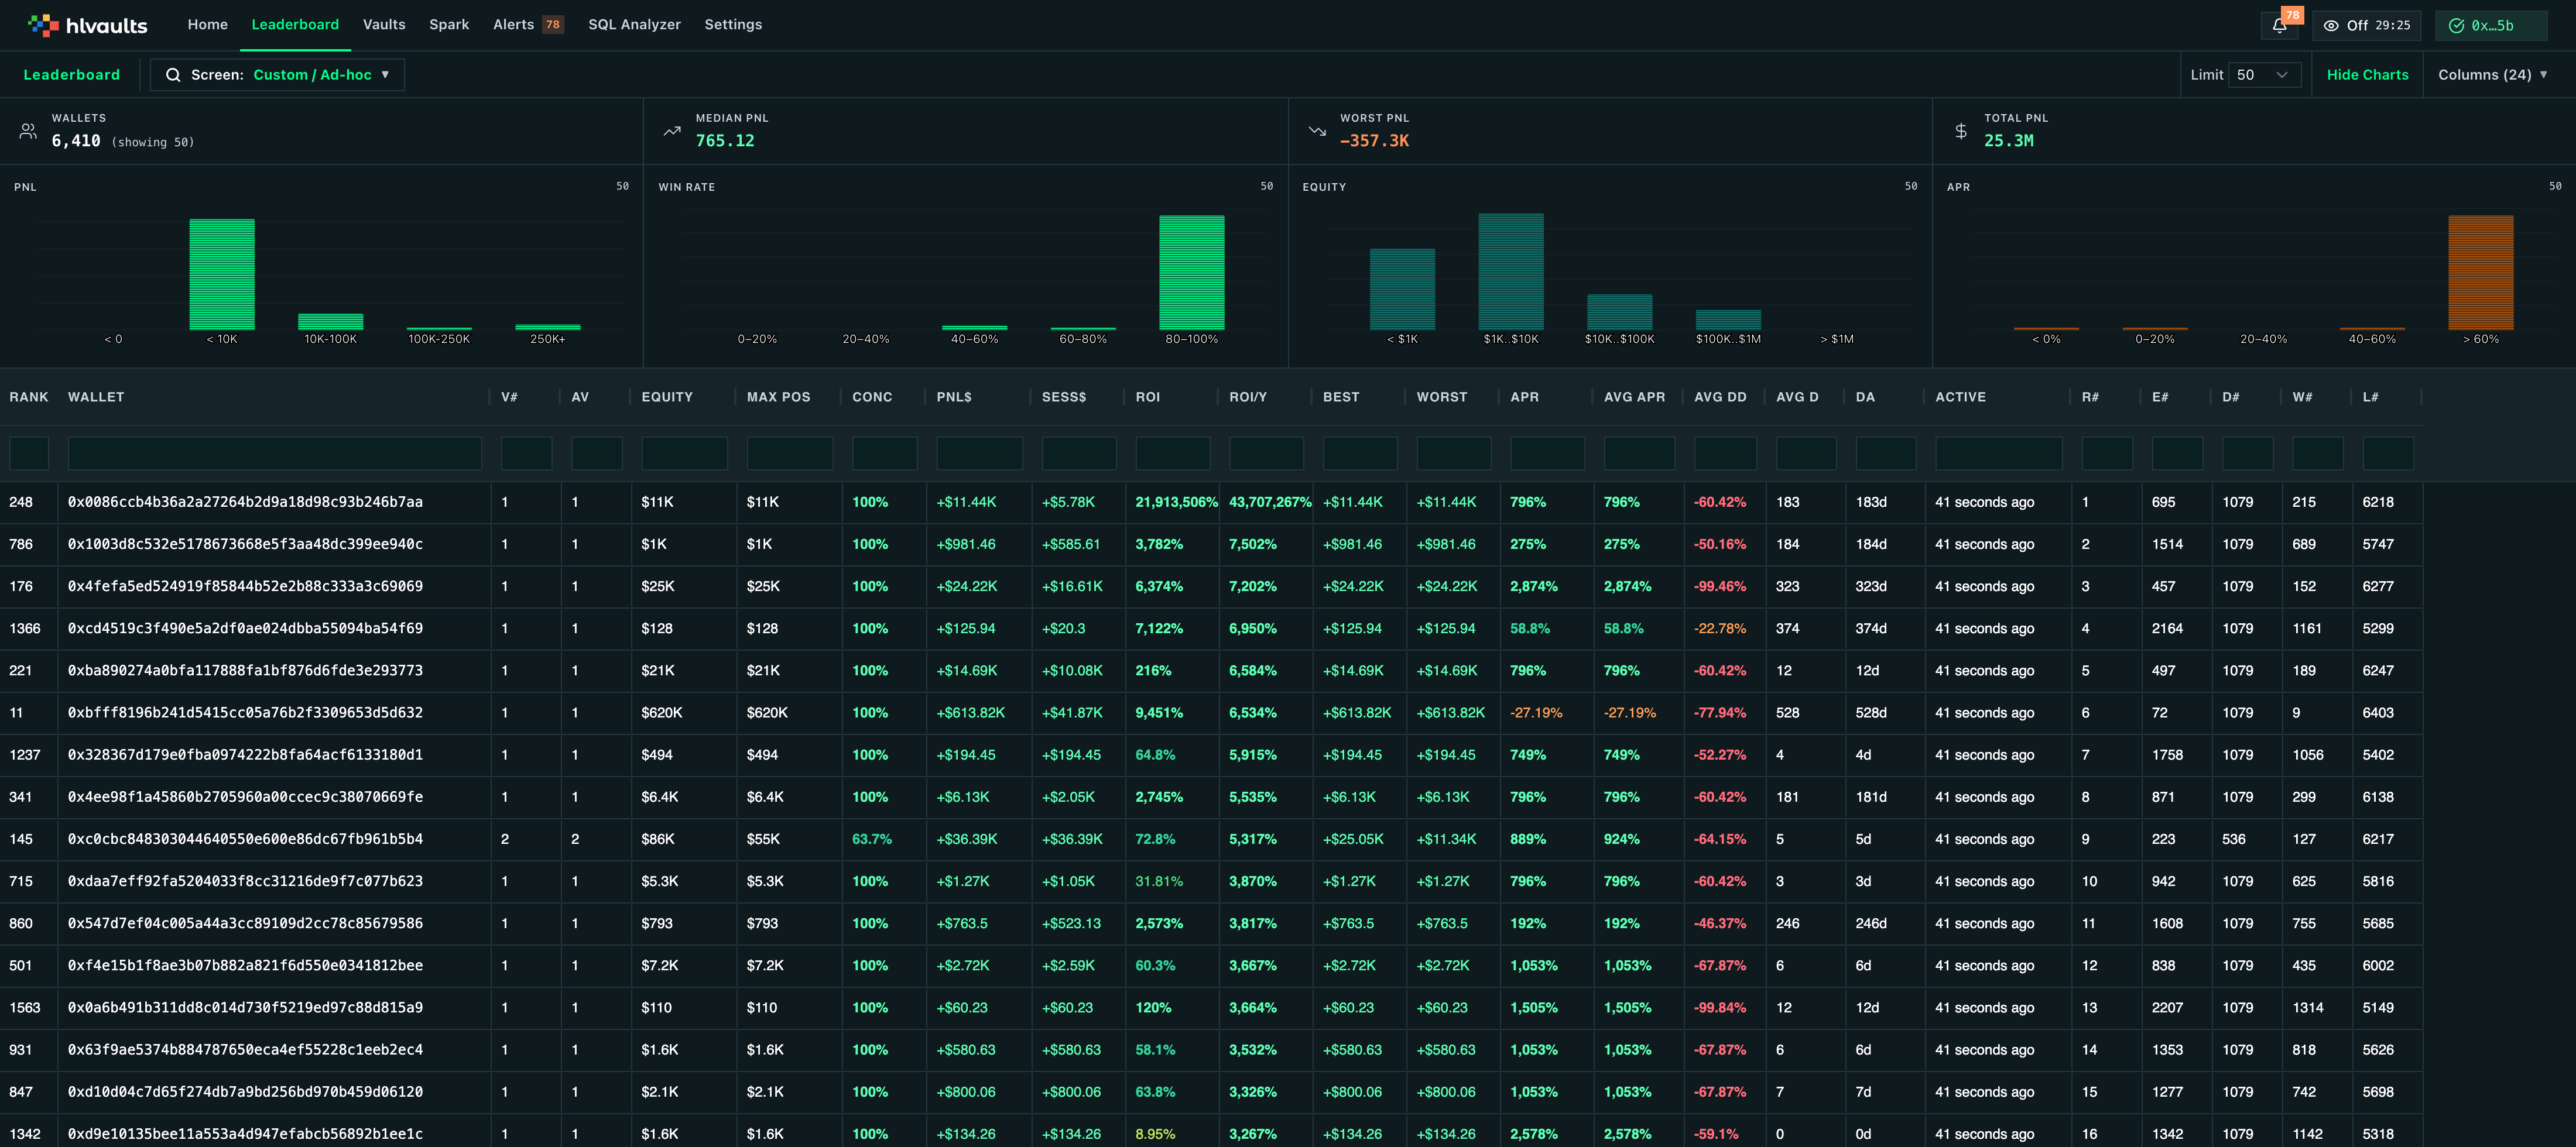
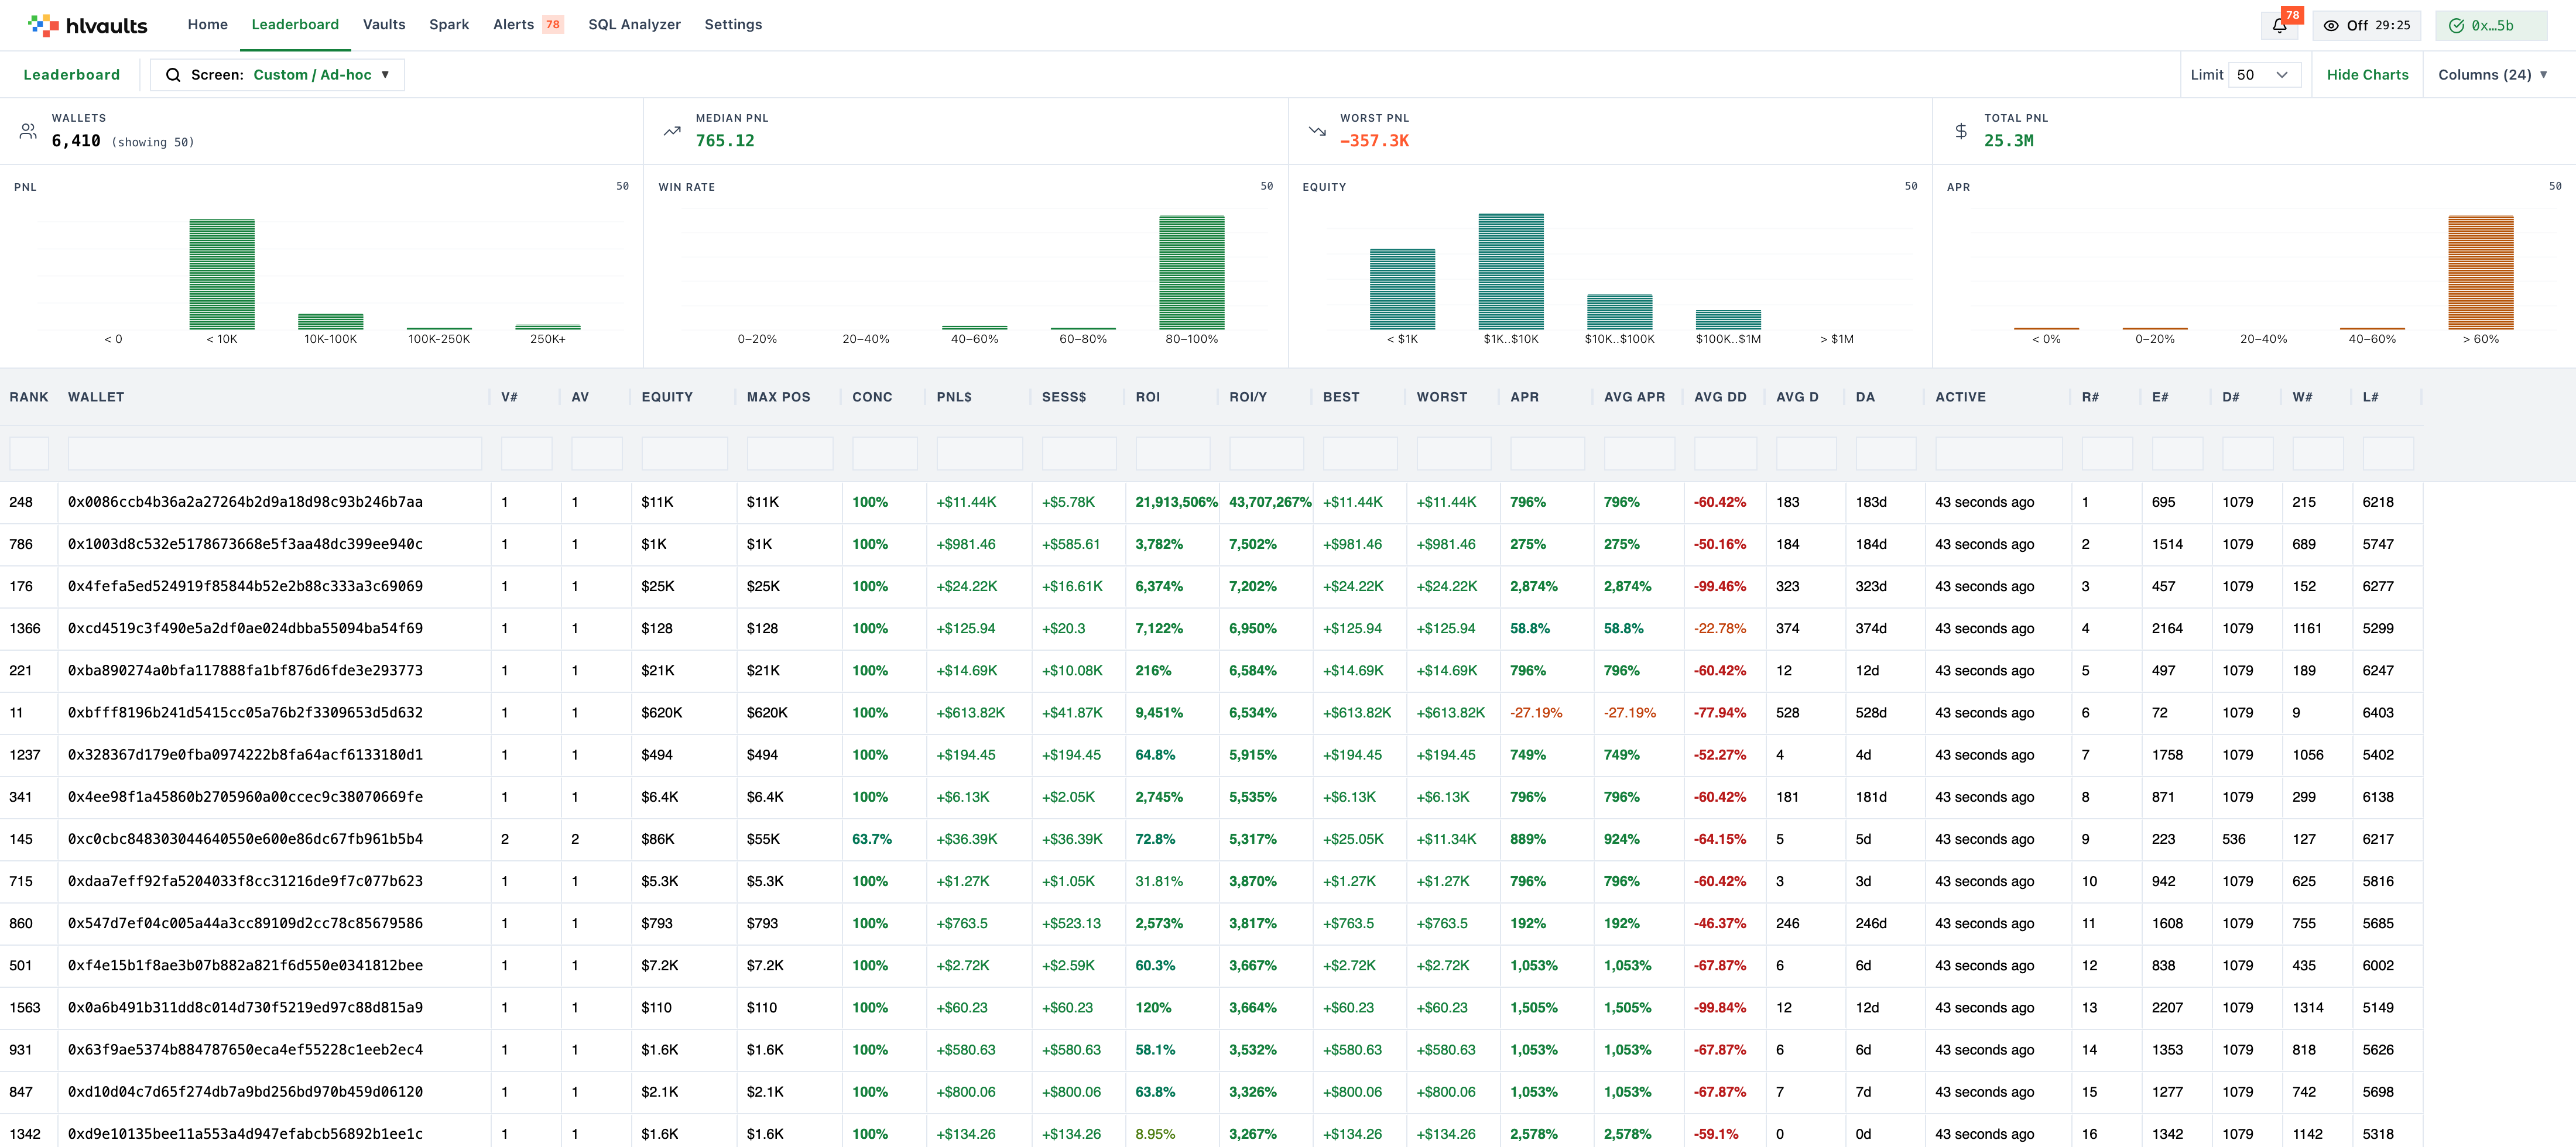
Every leaderboard column is available on all plans — your plan determines the number of wallet rows you can load (Top 5 on Free, Top 100 on Growth, Top 500 on Pro), not which columns you can see.
Identity & Rankings
Section titled “Identity & Rankings”These columns identify each wallet and show where it ranks.
Rank —
Section titled “Rank —”The wallet’s position in the leaderboard, sorted by all-time PnL descending.
Rank = position when sorted by total_all_time_pnl DESC
This is the default sort. Rank 1 is the wallet with the highest all-time PnL across all vaults.
Wallet
Section titled “Wallet”The wallet address (0x…). On Growth and Pro, clicking it opens the vaults grid pre-filtered to show only vaults this wallet participates in.
ROI Rank
Section titled “ROI Rank”Rank by annualized ROI. Shows which wallets deliver the best returns relative to their capital.
ROI Rank = position when sorted by annualized_roi DESC
Useful for finding capital-efficient wallets. A wallet ranked #1 by PnL but #50 by ROI is making money mostly through large capital, not superior returns.
Equity Rank
Section titled “Equity Rank”Rank by total equity across all vaults.
Equity Rank = position when sorted by total_equity DESC
Identifies the most capitalized wallets — the “whales” of Hyperliquid vaults.
Diversification Rank
Section titled “Diversification Rank”Rank by number of active vaults. Higher = more diversified.
Div. Rank = position when sorted by active_vault_count DESC
A wallet ranked #1 by diversification is in more vaults than any other wallet — their eggs are in many baskets.
Win Rate Rank
Section titled “Win Rate Rank”Rank by win rate percentage.
Win Rate Rank = position when sorted by win_rate DESC
A wallet with 100% win rate has profitable positions in every vault they’re in (ranked #1).
Loss Rank
Section titled “Loss Rank”Rank by biggest loss on a single vault. Lower rank = bigger loss.
Loss Rank = position when sorted by worst_vault_pnl ASC
This ranks by the magnitude of loss — rank 1 is the wallet with the single largest losing position. Useful for identifying risk management issues.
Portfolio Size
Section titled “Portfolio Size”These columns measure how much capital a wallet has deployed.
Equity
Section titled “Equity”Total current value across all vault positions.
Equity = sum of vault_equity for all vaults this wallet is in
Includes both liquid (unlocked) and locked equity. This is the wallet’s total skin in the game.
Liquid
Section titled “Liquid”Portion of equity that is unlocked and withdrawable.
Liquid = sum of vault_equity for vaults where lockup has expired
High liquidity means flexibility — the wallet can exit positions quickly if needed.
Locked
Section titled “Locked”Portion of equity that is still in lockup.
Locked = total equity - liquid equity
High locked equity indicates the wallet is committed for the long term.
Largest Position
Section titled “Largest Position”The single largest vault position this wallet holds.
Concentration
Section titled “Concentration”What percentage of total equity is in the single largest position.
Concentration = largest_position_equity / total_equity
- < 20%: Well diversified
- 20-50%: Moderately concentrated
- > 50%: Highly concentrated — one vault dominates the wallet’s portfolio
Vaults Count
Section titled “Vaults Count”Total number of vaults this wallet has ever participated in (active + exited).
Active Vaults
Section titled “Active Vaults”Number of vaults the wallet currently has equity in.
Exited Vaults
Section titled “Exited Vaults”Number of vaults the wallet has fully exited.
Exited = total vaults - active vaults
A high exit count could mean the wallet is actively rotating between strategies, or they gave up on those vaults.
PnL & Returns
Section titled “PnL & Returns”These columns measure profitability.
All PnL
Section titled “All PnL”Total all-time profit/loss across every vault this wallet has ever participated in.
All PnL = sum of all_time_pnl across all vaults
This is the aggregate performance metric. A positive All PnL means the wallet is net profitable overall.
Session PnL
Section titled “Session PnL”Current session PnL across all vaults.
This reflects recent performance. Compare to All PnL to see if the wallet’s recent performance matches their long-term track record.
Best PnL
Section titled “Best PnL”The highest PnL this wallet has achieved on a single vault position.
Worst PnL
Section titled “Worst PnL”The lowest (most negative) PnL this wallet has experienced on a single vault. Shows their biggest mistake.
Simple total return on investment across all vaults.
ROI = total_all_time_pnl / (total_equity - total_all_time_pnl)
Shows the overall return percentage. Does not account for time — a wallet could achieve 50% ROI over 2 years or 2 months.
ROI (Annualized)
Section titled “ROI (Annualized)”Annualized return, normalized for the time each position was held.
ROI Ann. = ROI × (365 / avg_days_following)
This is the most comparable performance metric across wallets with different investment horizons.
Percentage of vault positions that are profitable.
Win % = winning_vault_count / total_vault_count
- > 80%: Exceptional selectivity
- 60-80%: Good — most decisions are right
- 40-60%: Average — about half of vault picks work out
- < 40%: Below average — most picks lose money
Wins / Losses
Section titled “Wins / Losses”Count of vault positions that are profitable.
Count of vault positions that are unprofitable.
These columns measure risk exposure.
Equity-weighted average APR across all vaults the wallet is in.
APR = weighted average of vault_apr by equity share
Shows the blended return rate the wallet is earning. Weighted by size — larger positions contribute more to the average.
Average Vault APR
Section titled “Average Vault APR”Simple (unweighted) average of vault APRs. Each vault counts equally regardless of position size.
Compare to APR — if APR is much higher than Avg Vault APR, the wallet’s largest positions are in high-APR vaults.
Average Drawdown
Section titled “Average Drawdown”Average of all max drawdowns across vaults the wallet is in.
Avg DD = average of all_time_max_drawdown for all vaults
Shows the typical risk level of the wallet’s vault picks.
Worst Drawdown
Section titled “Worst Drawdown”The worst (highest) single-vault drawdown the wallet has experienced.
Shows the worst-case scenario the wallet has actually endured. If this is -50% or worse, the wallet has survived (or is still in) a severe drawdown event.
Time & Activity
Section titled “Time & Activity”These columns measure the wallet’s tenure and engagement.
Average Days
Section titled “Average Days”Average number of days the wallet has been in each vault.
Avg Days = average of days_following across all vaults
Higher values suggest loyal, long-term depositors.
Longest Days
Section titled “Longest Days”The single longest period the wallet has been in any vault.
Total Days
Section titled “Total Days”Sum of all days across all vaults.
Total Days = sum of days_following across all vaults
A wallet with 10 vaults and 100 days each has 1,000 total days.
Days Active
Section titled “Days Active”Days since the wallet’s first entry into any vault.
Days Active = today - first_vault_entry_date
Shows how long the wallet has been participating in Hyperliquid vaults overall.
First Entry
Section titled “First Entry”Date the wallet first deposited into any vault.
Last Entry
Section titled “Last Entry”Date of the wallet’s most recent vault entry.
A recent Last Entry suggests the wallet is actively deploying new capital.
Last Active
Section titled “Last Active”When the wallet last had any activity (shown as relative time).
- “2 hours ago”: Active trader
- “3 days ago”: Recent activity
- “2 months ago”: Inactive — may have moved on