Vault Detail
Click any vault name in the grid to open its detail page. This is where you move from the overview — identifying promising vaults on the leaderboard — to the analysis that tells you whether one is worth your capital.
The page is organized into tabs, each designed to answer a specific question about the vault.
What you’ll find in each tab
Section titled “What you’ll find in each tab”Work through these in order when evaluating a vault for the first time:
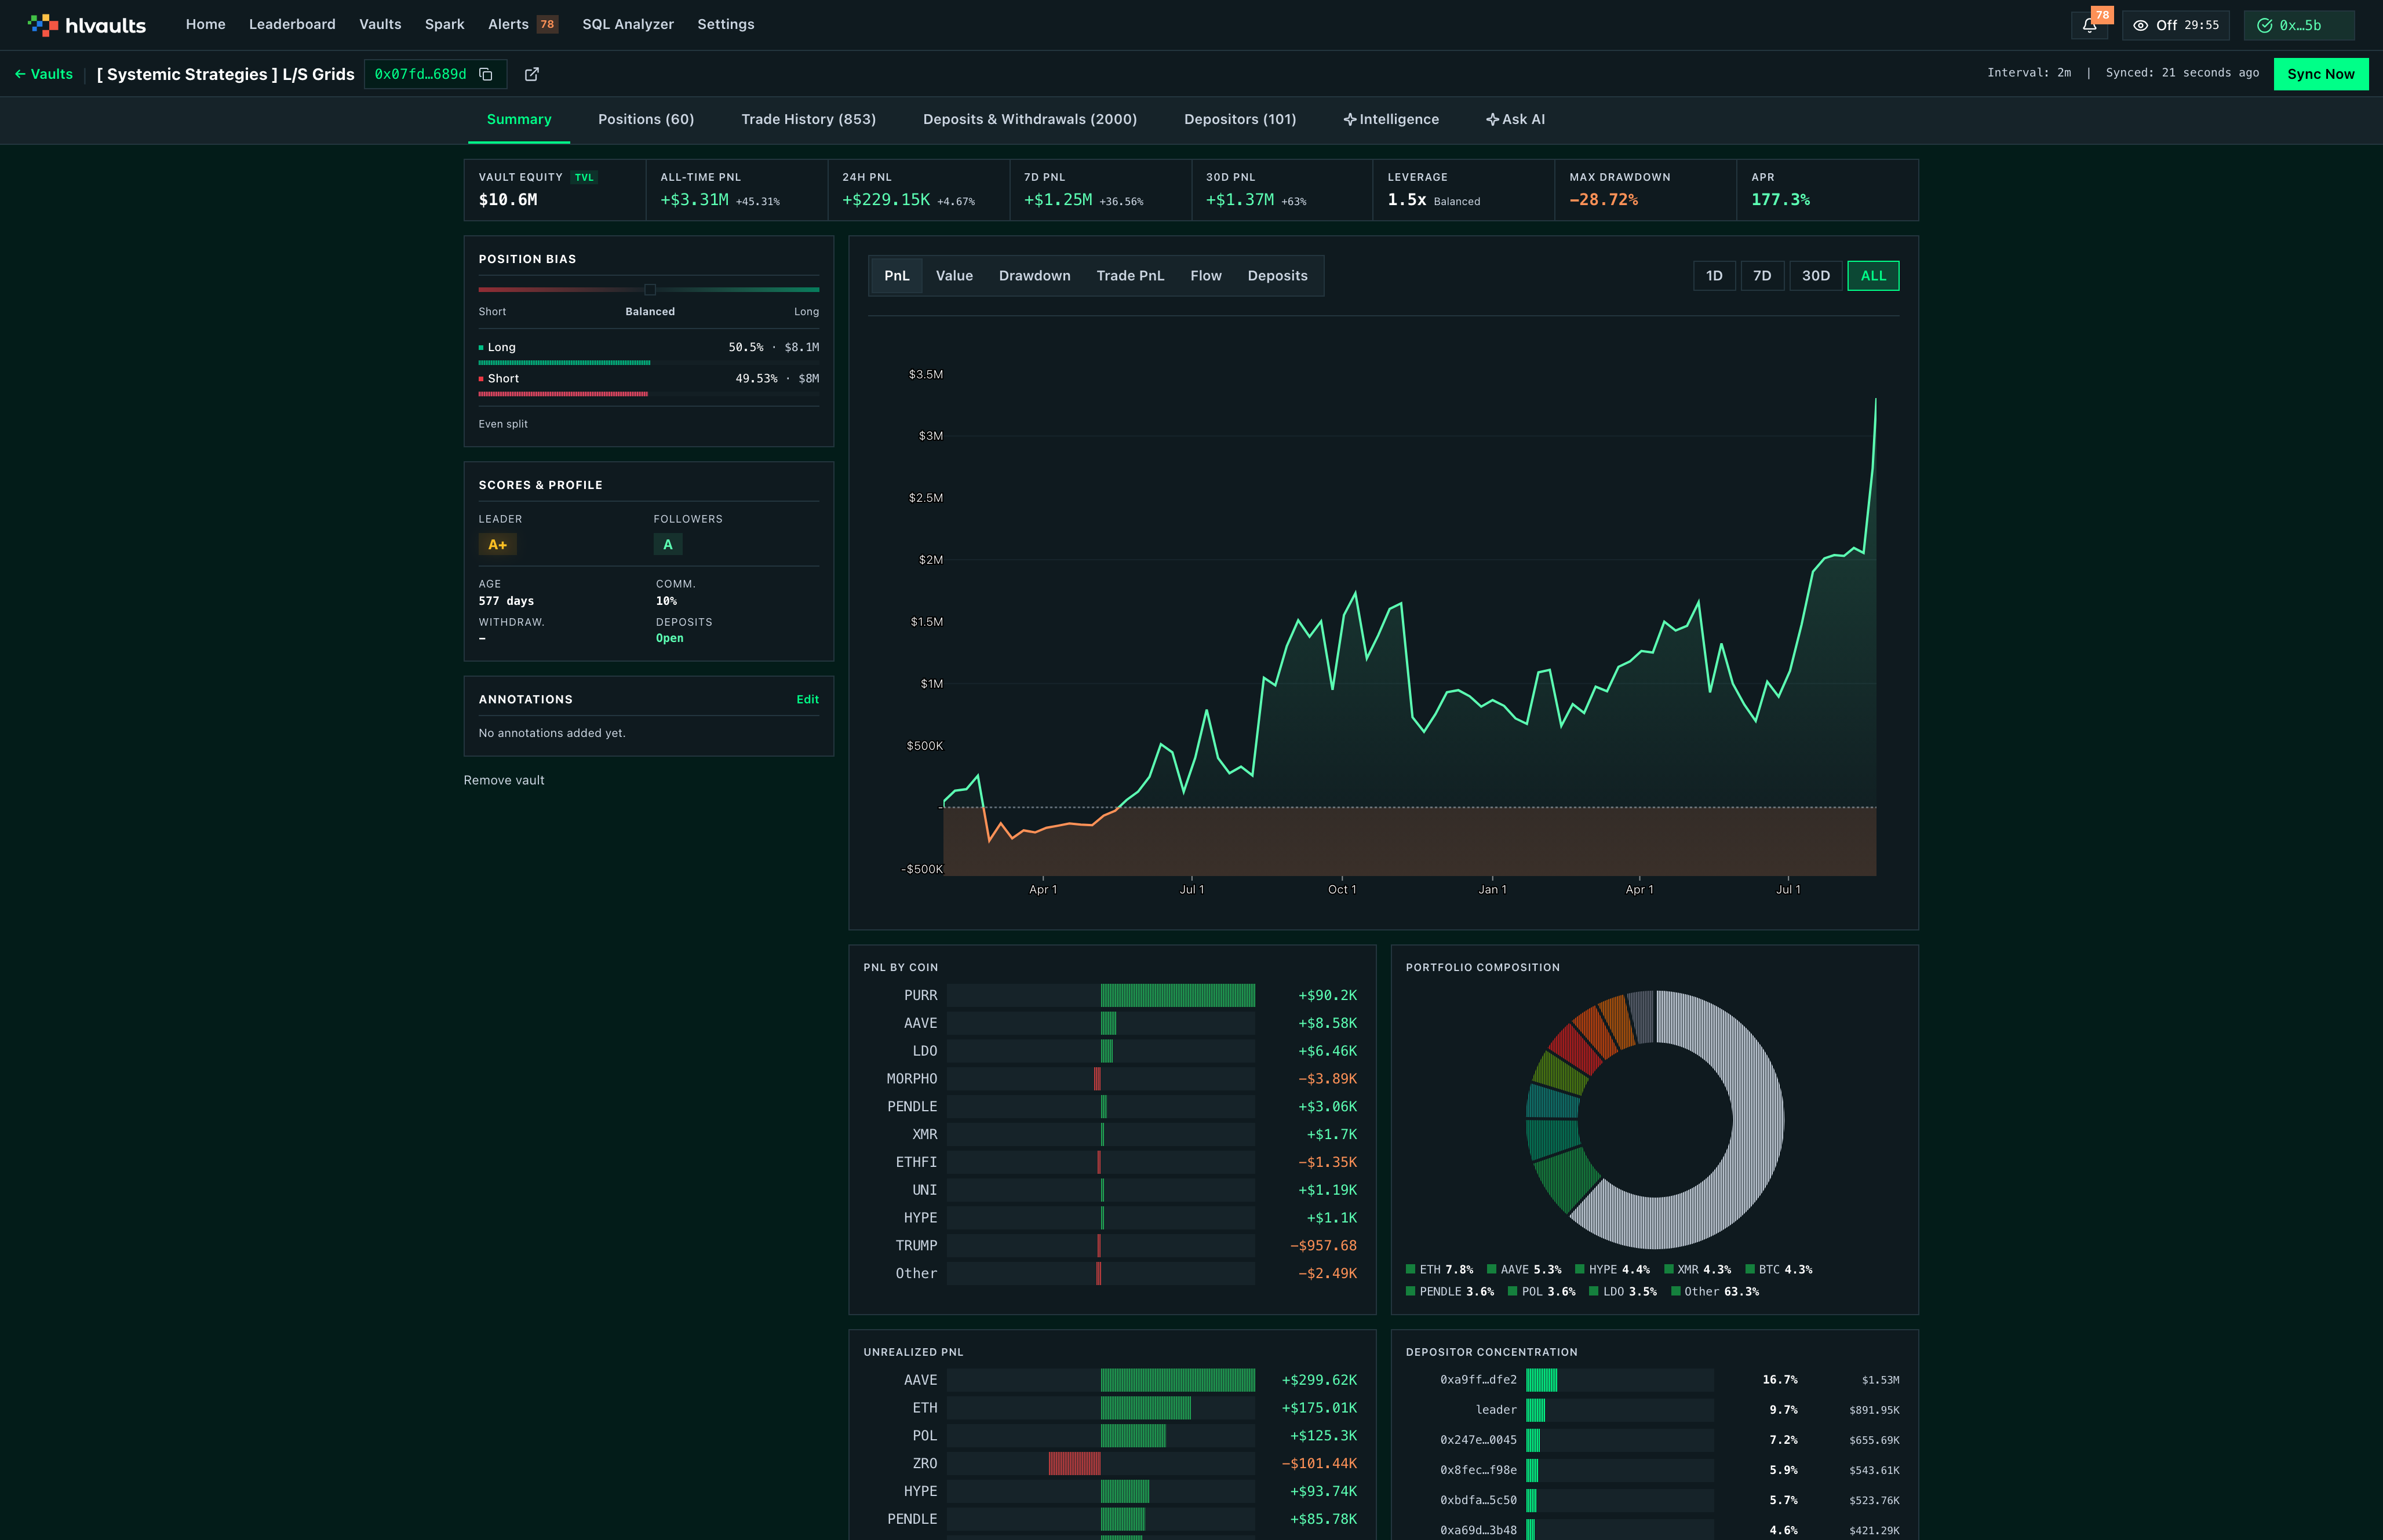
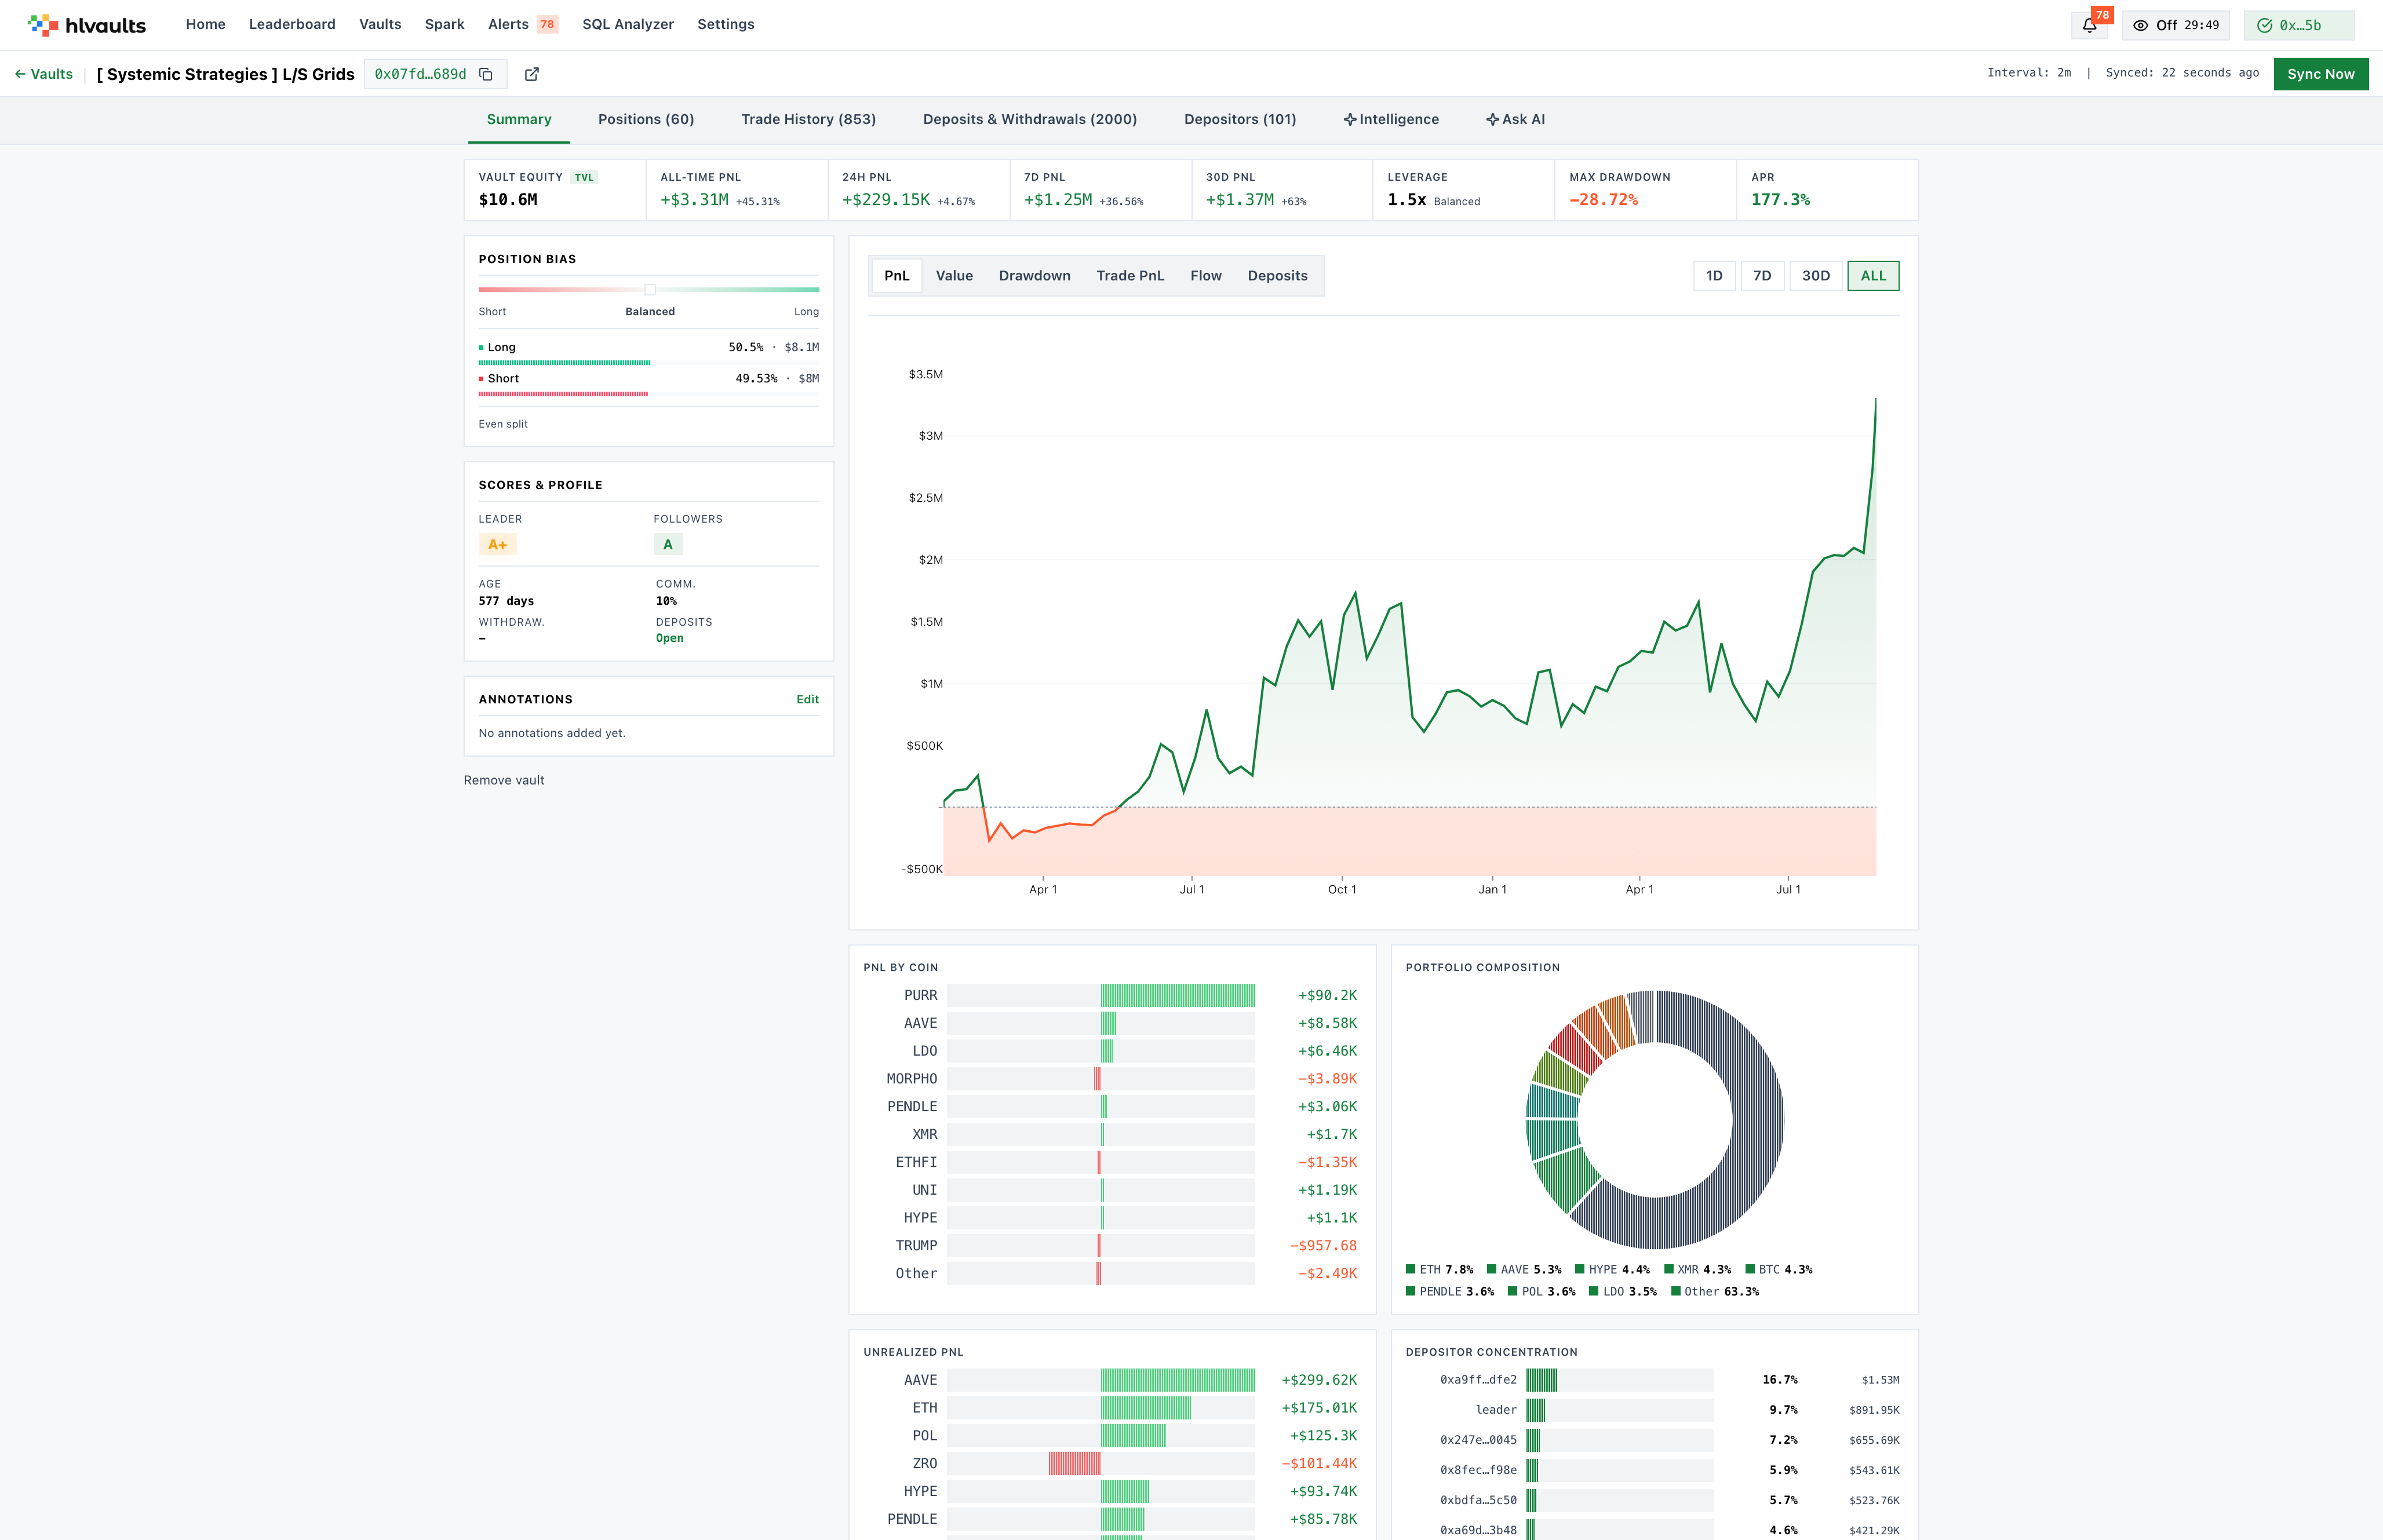
- Summary — The default view. A performance dashboard with KPIs, charts, and quick-reference cards. Start here to get the 30,000-foot view.
- Positions — Every open position the vault is currently holding. Tells you what the leader is betting on and how they’re sizing those bets.
- Trade History — Every fill the leader has executed. Use this to assess execution quality, frequency, and fee efficiency.
- Deposits & Withdrawals — Every capital event. Track flows in and out of the vault to understand depositor behavior and capital stability.
- Depositors — All wallets ranked by equity. Evaluate concentration risk and identify the vault’s capital base.
- Intelligence — Quantitative signals and AI-generated analysis. Deeper diagnostics on style, risk, and correlations.
- Ask AI — A natural language chat interface scoped to this vault. Ask specific questions without jumping between tabs.
Vault header
Section titled “Vault header”The header at the top of every detail page displays the vault’s name, its on-chain address, and a sync status indicator.
Data is fetched periodically, but you can click Sync Now to pull the latest on-chain state immediately. Use this after a large move or when you’re about to make a decision and want the freshest data.
Remove a vault
Section titled “Remove a vault”Click Remove on the Summary tab to hide the vault from your grid. This is reversible — removed vaults can be restored from Settings → General → Show Removed Vaults. Use this to keep your grid focused on the vaults you’re actively tracking or evaluating.
Related
Section titled “Related”- Signals & Intelligence — signal cards and AI analysis explained
- Performance Metrics — LP and DP grade calculations
- Column Reference — vault grid columns