Trade History
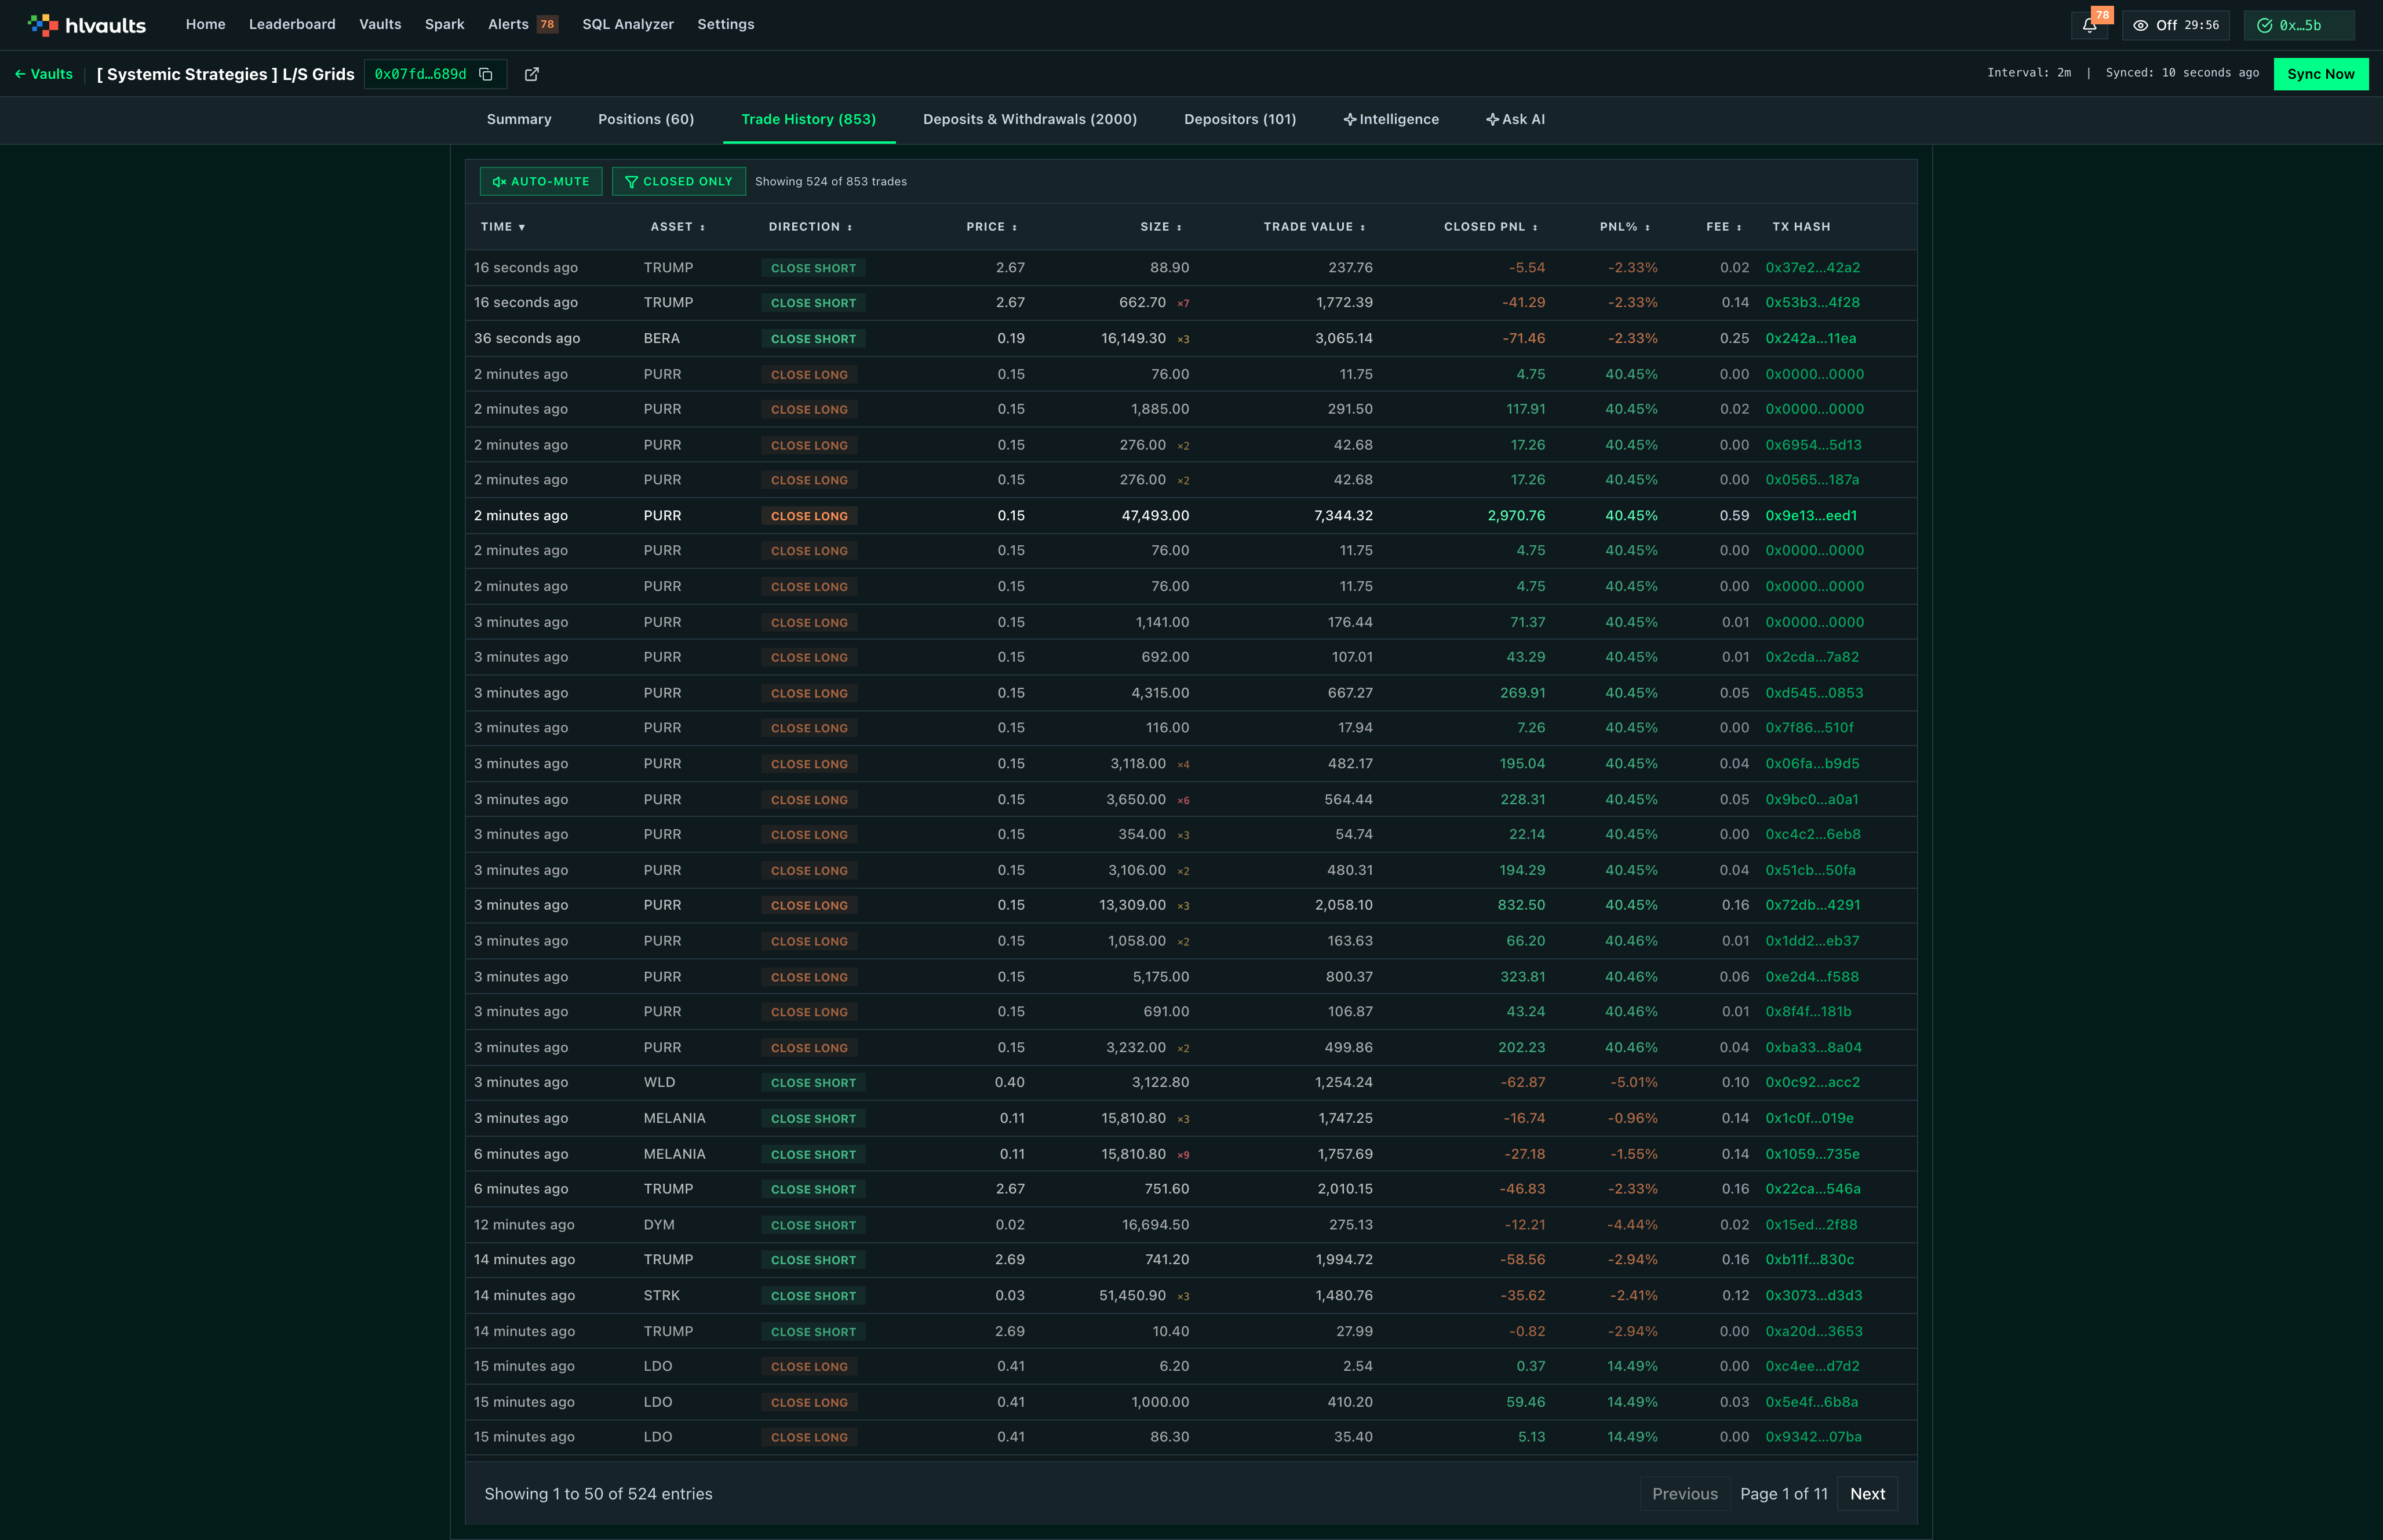
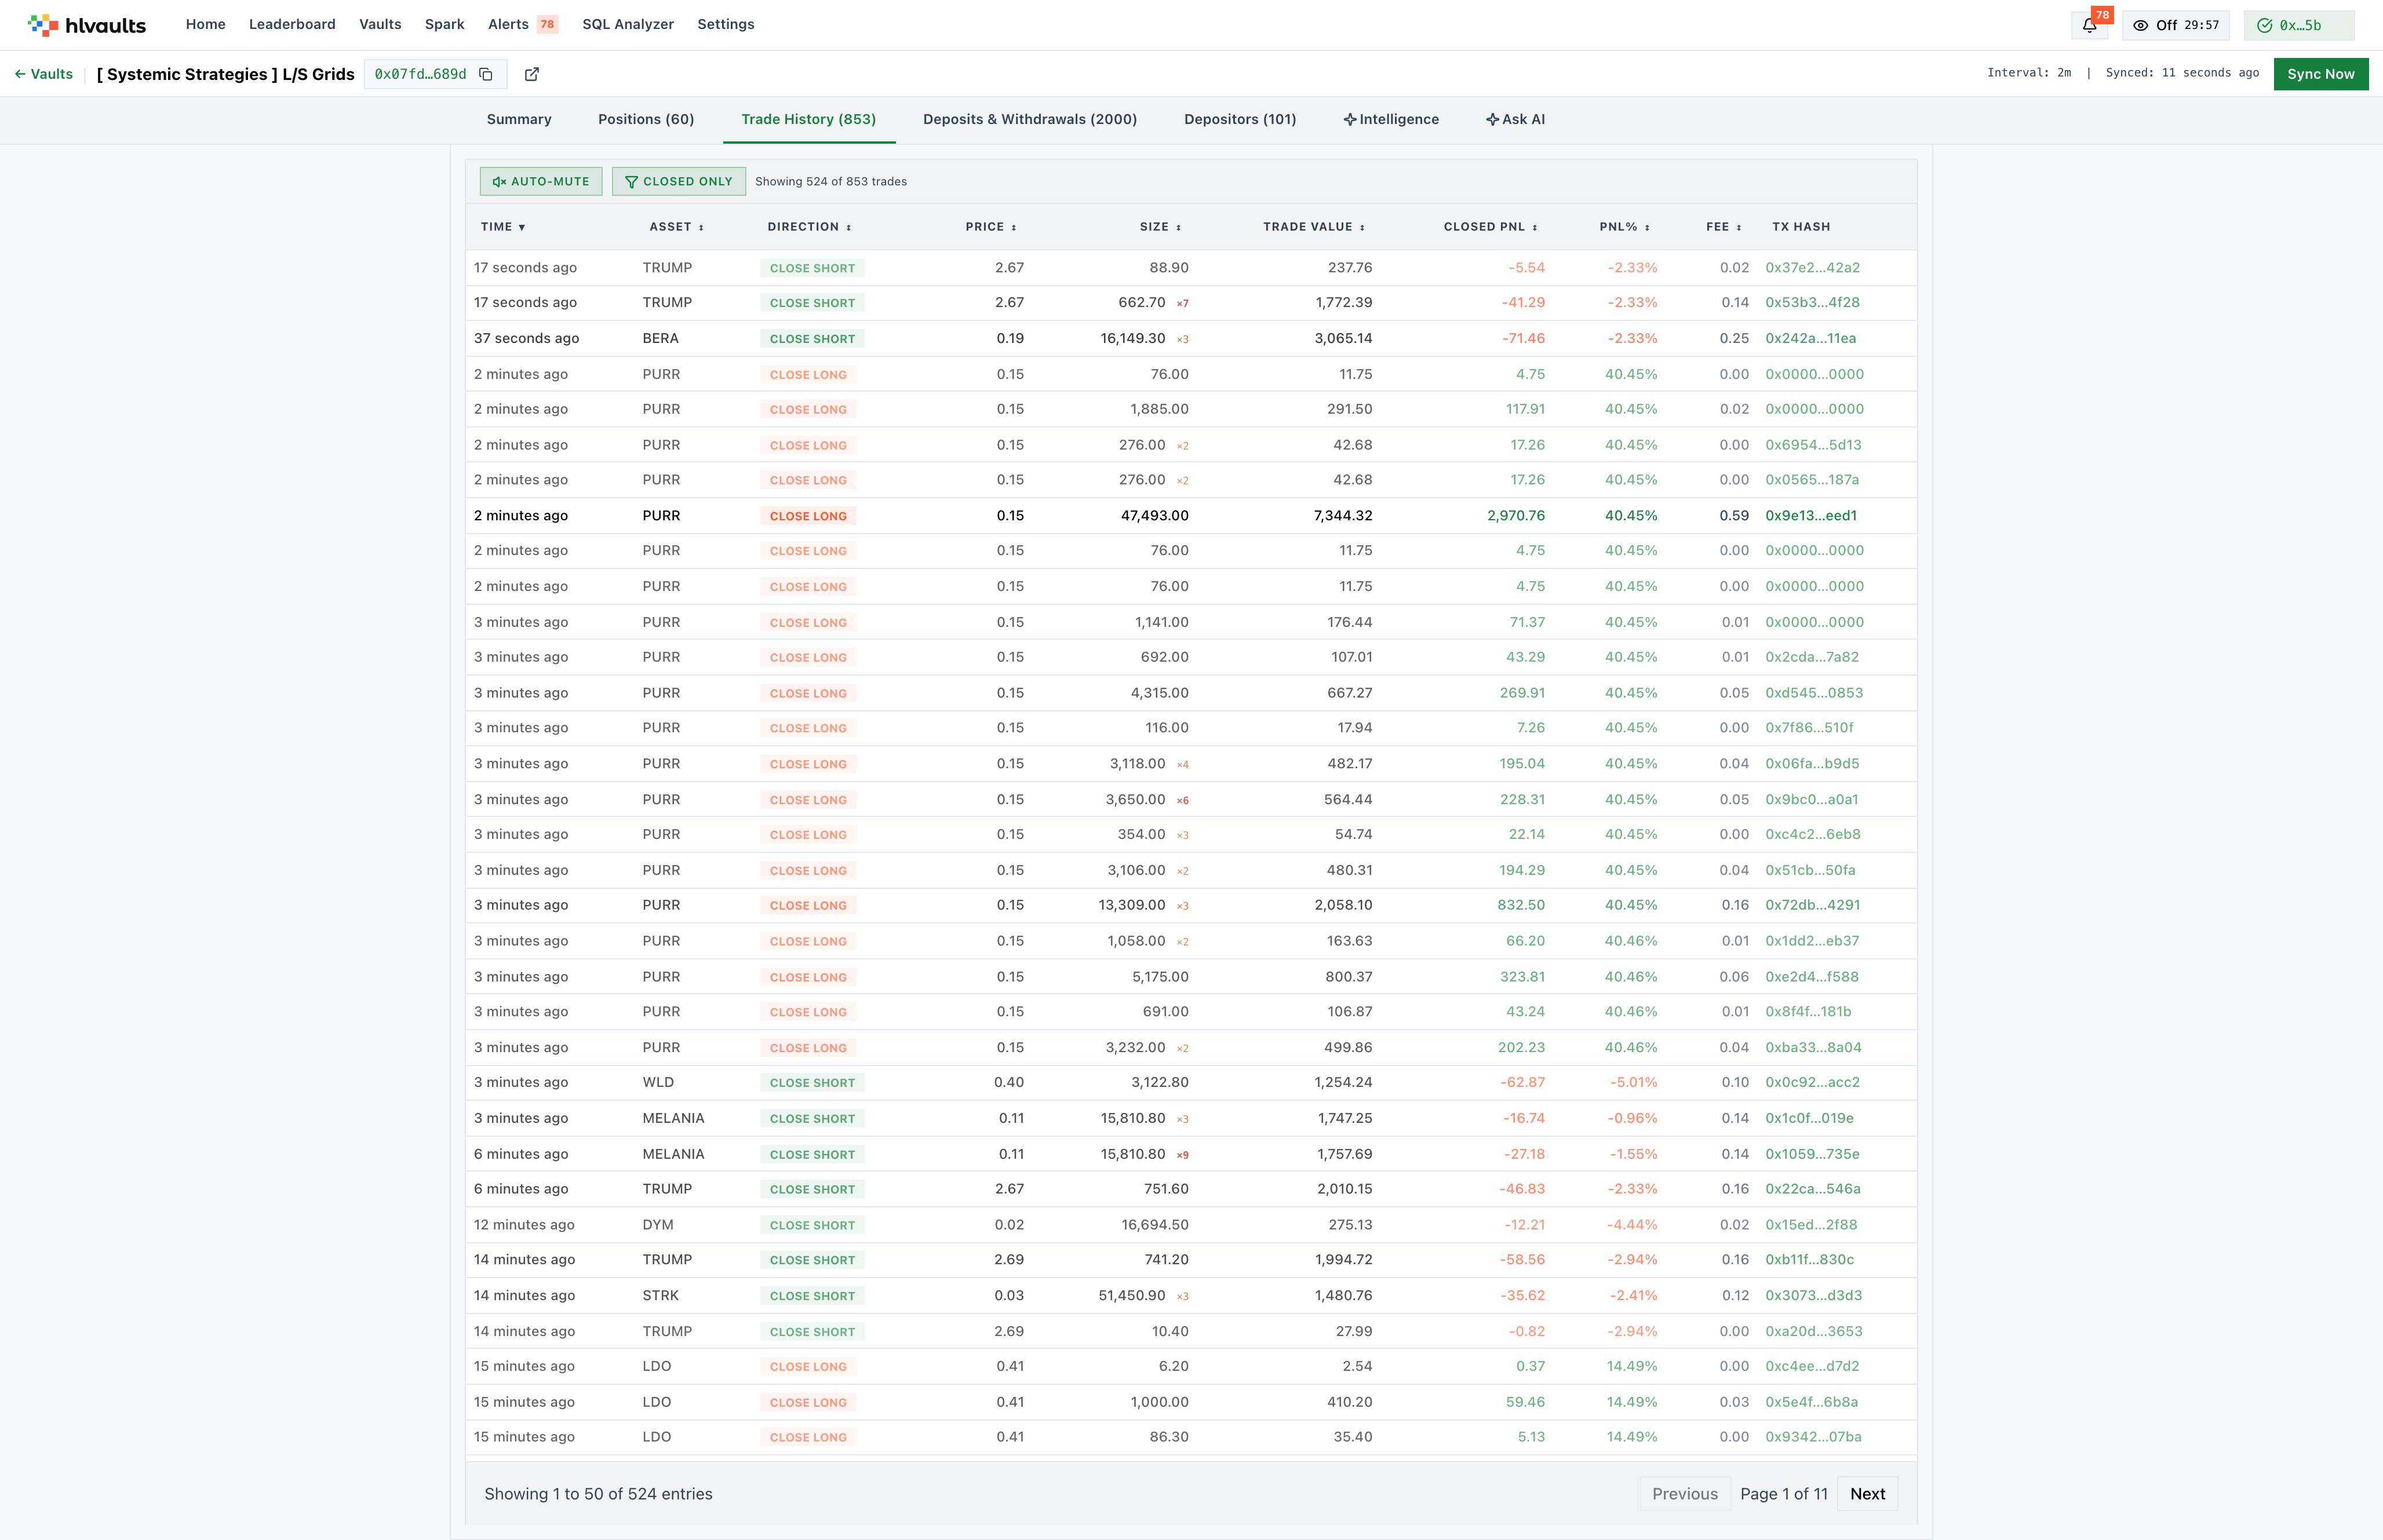
Every fill the vault leader has ever executed lives in the Trade History tab. Where the Positions tab tells you what the leader is currently holding, this tab shows how they got there — and everything else they’ve done along the way.
What each column shows
Section titled “What each column shows”| Column | Description |
|---|---|
| Time | When the trade executed. |
| Coin | The asset traded. |
| Side | Buy or sell. |
| Direction | Long or short. |
| Price | The execution price. |
| Size | Trade size. |
| Closed PnL | Realized PnL from the trade. |
| Fee | Trading fee paid. |
Tuning the view
Section titled “Tuning the view”Two toggles help you focus on the trades that matter:
- Auto-Mute — Filters out small or irrelevant fills. Toggle this on when you want to see only the trades that moved the needle.
- Closed Only — Limits the view to trades that have been fully closed. Use this when you want to evaluate the leader’s realized performance rather than their current open positions.
What to look for
Section titled “What to look for”Trade history reveals patterns that positions alone cannot. Look at execution frequency: does the leader trade constantly (high-frequency scalping) or pick spots (swing trading)? Look at fee patterns: high fees relative to position size suggest frequent churn. Look at Closed PnL distribution: does the leader grind out small winners or rely on a few home runs?
Sort by Closed PnL to see the best and worst trades. Sort by Fee to identify which assets or strategies are costing the most to execute.
Sorting and pagination
Section titled “Sorting and pagination”Sortable by Time, Coin, Price, Size, and Closed PnL. The table displays 50 rows per page with standard pagination.
Free Free accounts see a preview. Full trade history requires Growth.