

Column Reference
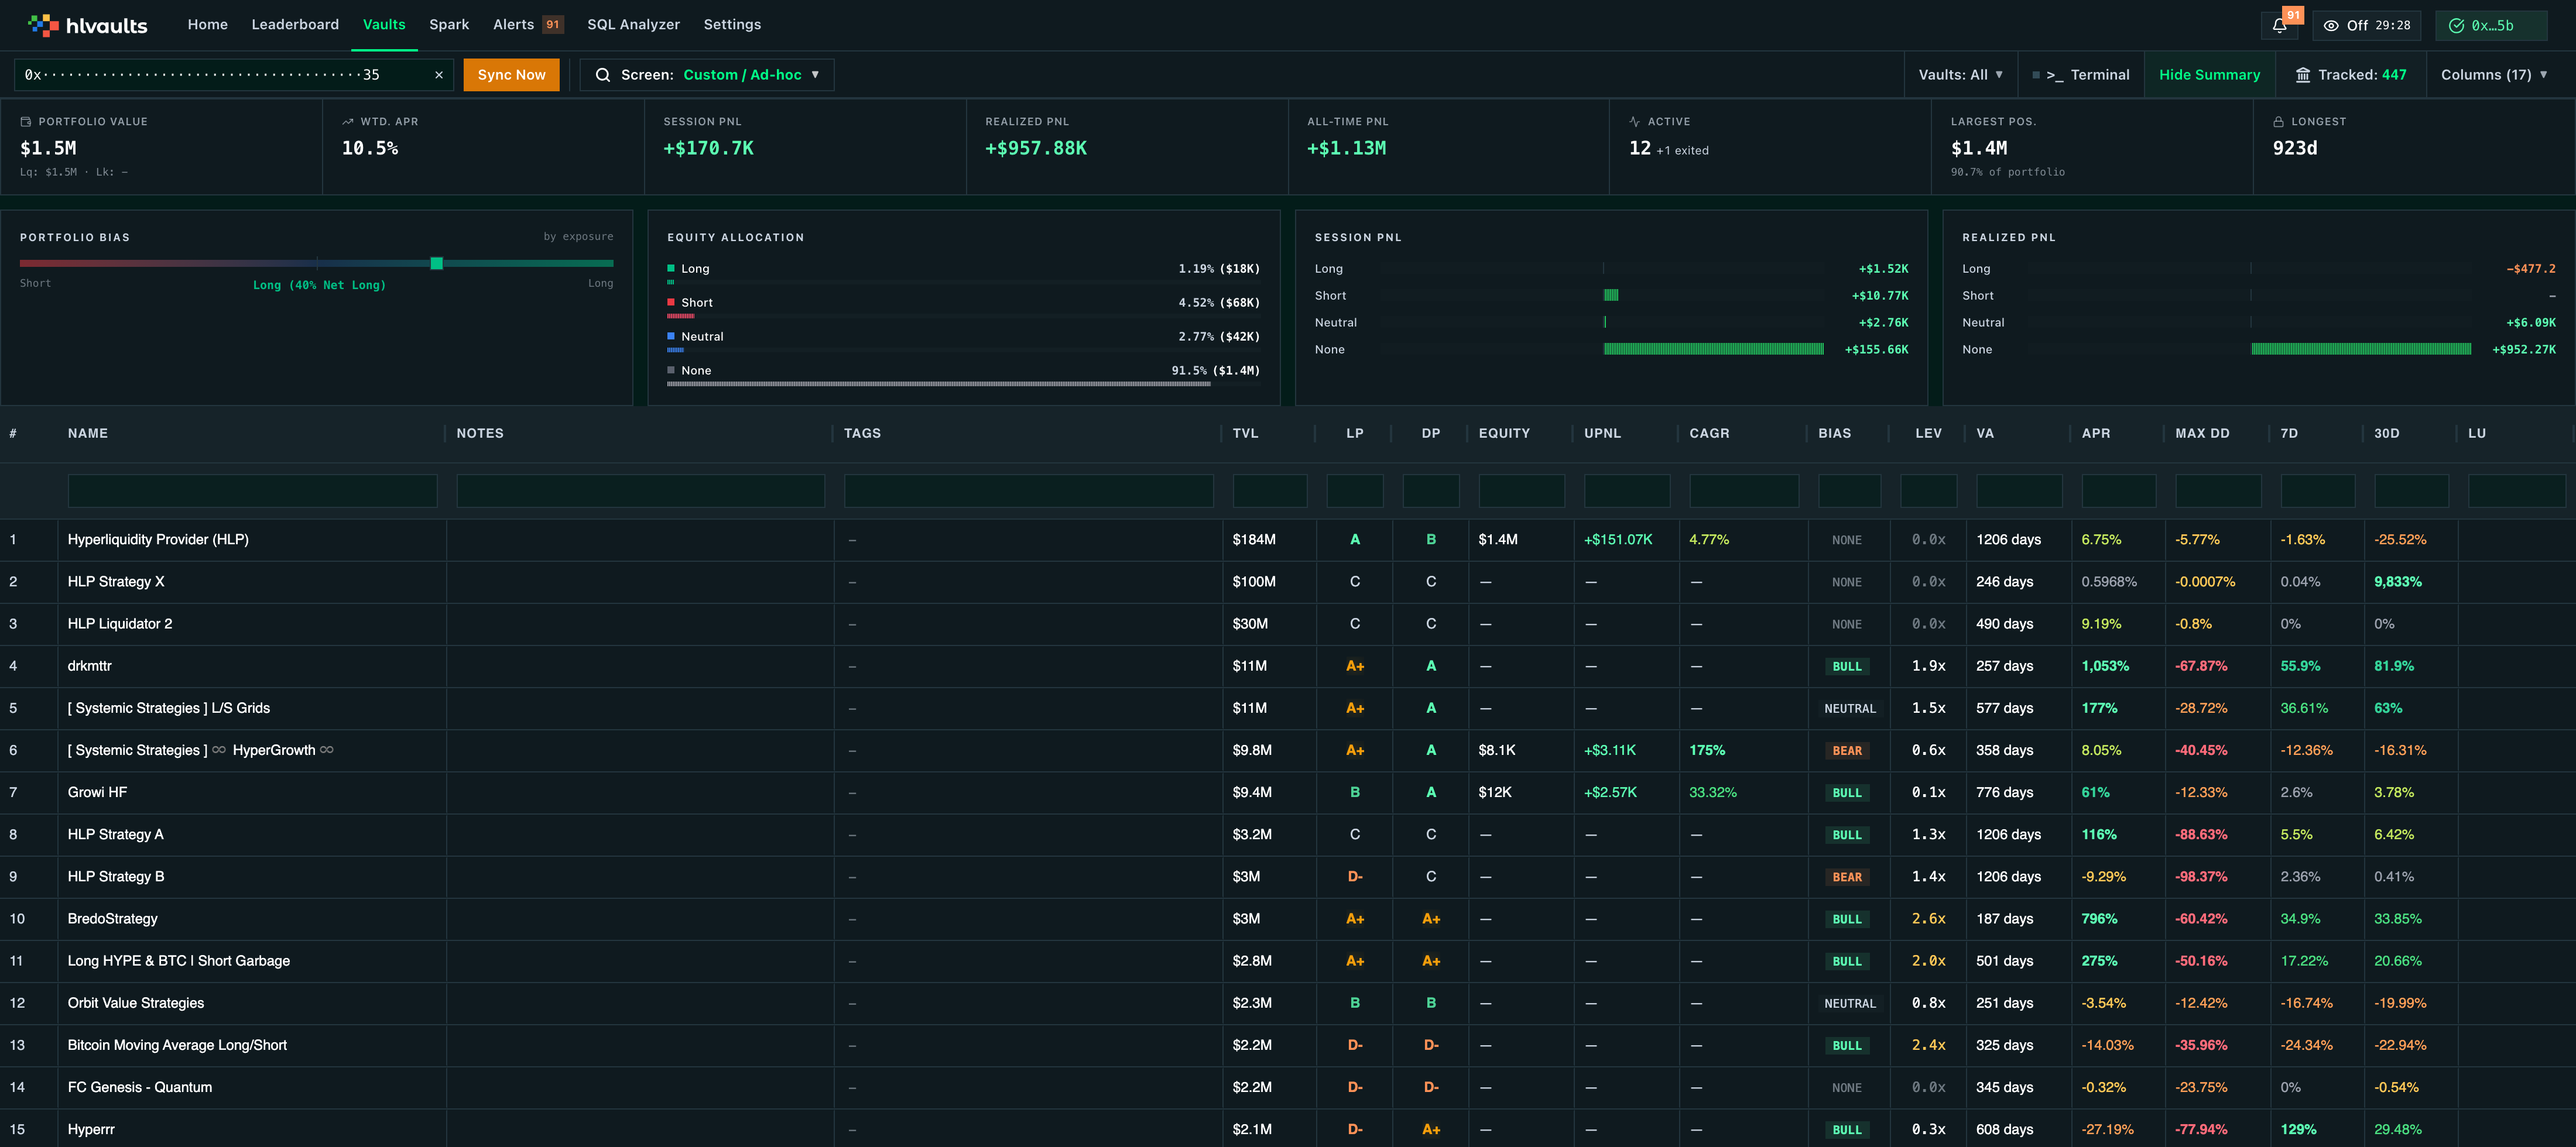
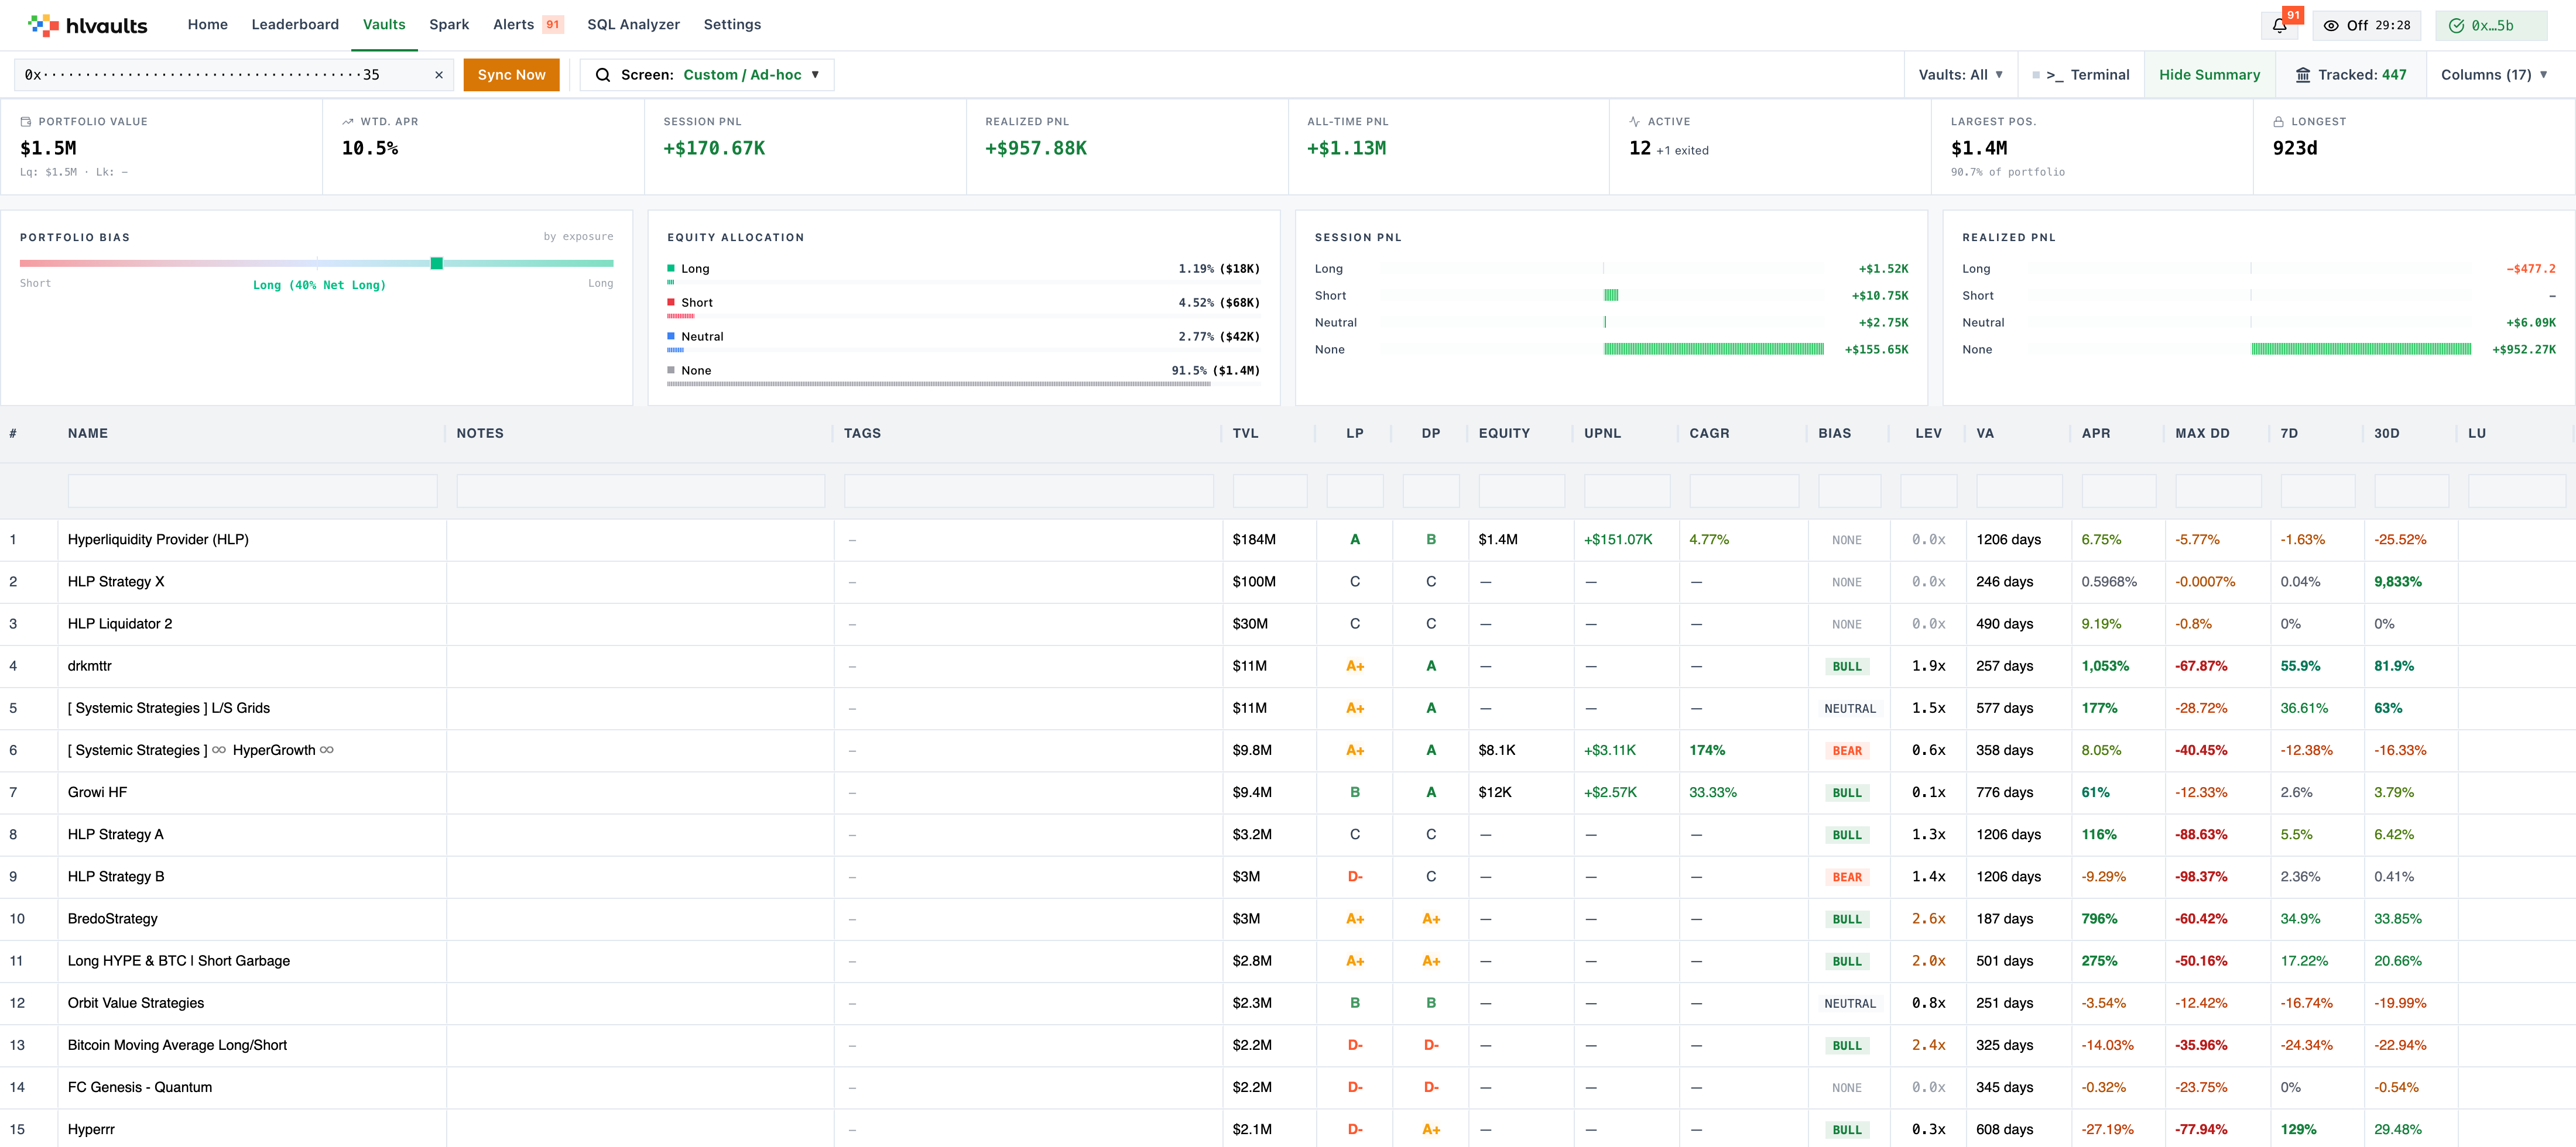
The vault grid has 35+ columns organized by category. This reference explains each column — what it measures, how the number is calculated, and what to look for.
Default columns are visible on the Free plan. All columns require Growth or higher.
Returns & Profitability
Section titled “Returns & Profitability”These columns measure how much money a vault has made (or lost).
Metric that annualizes the vault’s recent performance into a yearly percentage.
APR (Annual Percentage Rate) is the most commonly referenced return metric. It estimates what the vault’s return rate would be if sustained for a full year.
APR = recent_return × (365 / days_in_period)
The exact calculation window is determined by Hyperliquid. Higher APR is better, but be wary of extreme values — a 500% APR over 3 days is not a reliable signal.
The vault’s return over the most recent 24-hour trading period.
ROI_1D = (account_value_end - account_value_start) / account_value_start
Uses the first and last account value snapshots from the daily timeframe. Useful for spotting short-term volatility but noisy for decision-making.
Return over the trailing 7-day window.
ROI_7D = (account_value_end - account_value_start) / account_value_start
Same formula as 1D but from the weekly timeframe. A better short-to-medium term signal than 1D. Look for consistent positive 7D returns.
Return over the trailing 30-day window.
ROI_30D = (account_value_end - account_value_start) / account_value_start
Same formula from the monthly timeframe. This is a strong medium-term indicator. Compare 7D and 30D to assess consistency.
User PnL
Section titled “User PnL”Columns specific to your position in a vault. These only show data if you’ve entered your wallet addresses.
| Column | Abbr | Formula | What to look for |
|---|---|---|---|
| User Equity | Equity | vault_equity (direct from Hyperliquid) |
Your total stake in the vault |
| User PnL | UPnL | pnl (current session PnL, direct from Hyperliquid) |
Dollar profit/loss on your position this session |
| User UPnL % | UPnL % | pnl / (equity - pnl) |
Your unrealized (session) PnL as a percentage of initial equity |
| User UPnL % Annualized | UPnLA % | (pnl / (equity - pnl)) × (365 / days_following) |
Simple annualized version of your unrealized return |
| User UPnL CAGR | CAGR | (1 + pnl / (equity - pnl))^(365 / days_following) − 1 |
Compound annual growth rate of your unrealized return |
| User PnL % | PnL % | all_time_pnl / (equity - all_time_pnl) |
All-time return on your initial investment |
| User PnL % Annualized | APnL | (all_time_pnl / (equity - all_time_pnl)) × (365 / days_following) |
Annualized all-time return |
| User All-Time PnL | PnL$ | all_time_pnl |
Total cumulative PnL ever in this vault |
Your UPnL% = pnl / (equity - pnl)
Your UPnLA% = UPnL% × (365 / days_you_have_been_in_vault)
Your UPnL CAGR = (1 + UPnL%)^(365 / days_you_have_been_in_vault) − 1
CAGR is the default-visible annualized metric and the best single number to evaluate your own returns — it compounds your unrealized return over the period into an annual growth rate, and because it compounds, an annualized loss can never drop below −100%. UPnLA % is the simpler linear annualization. Both normalize for how long you’ve been invested; use the column picker to show or hide any of these.
Risk & Leverage
Section titled “Risk & Leverage”These columns measure how much risk a vault is taking.
Current Leverage
Section titled “Current Leverage”Shows how much leverage the vault currently has deployed.
Leverage = total_notional_position_value / account_value
1.0x= no leverage (all positions are fully collateralized)2.0x= twice the exposure relative to account value0.0x= no open positions
Higher leverage amplifies both gains and losses. A vault running 3-5x leverage is taking significantly more risk than one at 1-2x.
Sorting tip: Sort by leverage descending to find the most aggressive vaults, or ascending to find conservative ones.
Max Drawdown
Section titled “Max Drawdown”The largest peak-to-trough decline the vault has ever experienced.
Max Drawdown = max(peak - trough) / peak
Displayed as a negative percentage, e.g. -25.4%
This is the single most important risk metric. It tells you the worst-case scenario that actually happened.
- -5% to -15%: Low drawdown — conservative trading
- -15% to -30%: Moderate drawdown — normal for active trading
- -30% to -50%: High drawdown — aggressive strategy, significant risk
- Below -50%: Extreme — near-catastrophic losses
Look for: Vaults with strong returns AND low max drawdown. A vault returning 30% APR with a -8% max drawdown is exceptional.
Vault Age
Section titled “Vault Age”How long the vault has existed, in days.
Age = today - vault_creation_date
Displayed as “N days”
Age is a credibility signal. Older vaults have more track record data. Be cautious of very young vaults with exceptional returns — they may be riding a lucky streak.
Capital & Liquidity
Section titled “Capital & Liquidity”These columns measure the size and liquidity of the vault.
TVL (Total Value Locked)
Section titled “TVL (Total Value Locked)”Total capital deposited in the vault across all depositors.
TVL = sum of all depositor equity
Displayed compactly as $1.2M, $450K, etc.
- Higher TVL generally means more trust and stability
- Very low TVL (< $10K) vaults are excluded from the feed
- TVL can fluctuate as depositors enter and exit
Note: TVL is not a performance metric. A vault can have high TVL and poor returns, or low TVL and excellent returns.
Leader Share
Section titled “Leader Share”The percentage of the vault’s total capital that belongs to the leader.
Leader Share = leader_equity / TVL
A leader with significant skin in the game (high LS) is aligned with depositors. Low or zero leader share means the leader has little to lose.
Look for: Leaders with at least 5-10% of their own capital in the vault. It signals confidence in their own strategy.
Leader Commission
Section titled “Leader Commission”The percentage of profits the leader takes before distributing to depositors.
Leader Commission = leader_commission_fraction
Displayed as a percentage, e.g. 10%
- 0-5%: Low commission — favorable for depositors
- 10%: Typical
- 15-20%: High — the leader takes a significant cut
- > 20%: Unusual — only justified by exceptional returns
Max Distributable & Max Withdrawable
Section titled “Max Distributable & Max Withdrawable”The maximum amount of profit that can be distributed to depositors.
This is the vault’s undistributed profit — the pool of money available for distribution. Zero means either no profit or all profits have been distributed already.
The total amount of capital that can be withdrawn from the vault right now.
This is constrained by the vault’s available liquidity. If the vault has open positions, not all capital may be withdrawable at once.
The maximum amount you can withdraw from the vault, considering lockup periods and available liquidity.
Only shows data if you’ve entered your wallet. Equal to your equity if unlocked, or zero if still locked.
Allow Deposits
Section titled “Allow Deposits”Whether the vault is currently accepting new deposits.
- Yes: You can deposit capital
- No: The vault is closed to new deposits (may reopen later)
Leaders often close deposits during active trading to manage position sizing.
Trading Behavior
Section titled “Trading Behavior”These columns describe how a vault trades.
The vault’s directional bias based on its open positions. Shown as a colored badge.
long_equity = sum of all long position values short_equity = sum of all short position values gross_exposure = long_equity + short_equity net_exposure = long_equity - short_equity ratio = net_exposure / gross_exposure
Bull → ratio > 0.1 Bear → ratio < -0.1 Neutral → positions exist but ratio in [-0.1, 0.1] None → no open positions
| Badge | Meaning |
|---|---|
| Bull (green) | Vault is net long — betting on prices going up |
| Bear (red) | Vault is net short — betting on prices going down |
| Neutral (gray) | Mixed positions, roughly balanced |
| None (gray) | No open positions |
Watch for: A vault that’s consistently Bull during a market uptrend may be different from one that’s consistently Bear during the same period. Bias style is part of the leader’s trading personality.
Tags are real-time signals computed from the vault’s current state. They warn about specific situations.
| Tag | Meaning |
|---|---|
| Stop The Bleed | Your PnL is below -5% and unlocked — consider cutting losses |
| Bleeding Red | Your PnL is below -15% and unlocked — urgent attention |
| Take Profit | Your PnL is above 5% and unlocked — profit is real only once closed |
| God Mode | Leverage at 10x or higher — margin-call risk |
| Short Exit Window | Profitable and leveraged above 3.5x with nothing locked |
| Don’t Chase the Exit | No positions, leverage below 0.5x, stale (12h+ since last trade) |
| Inactive | No positions and no trade in 5+ days |
Tags are updated in real time as the vault’s state changes. They’re a quick way to spot vaults that need attention. Free accounts see one matching tag; Growth and Pro see all. See the Tags Reference for full condition details.
Leader & Depositor Grades
Section titled “Leader & Depositor Grades”These are the flagship performance evaluation columns.
Leader Performance (LP)
Section titled “Leader Performance (LP)”Annualizes the leader’s personal PnL and converts it to a letter grade.
leader_annualized_pnl = (leader_all_time_pnl / (leader_equity - leader_all_time_pnl)) × (365 / days_leader_has_been_followed)
Grade thresholds: A+ → ≥ 100% annualized A → ≥ 33% annualized B → ≥ 5% annualized C → ≥ 0% annualized D → > -10% annualized D- → ≤ -10% annualized
This is the single best metric to evaluate the leader’s trading ability. It normalizes for time and capital size.
Depositor Performance (DP)
Section titled “Depositor Performance (DP)”Averages the PnL across the vault’s top qualifying depositors and grades the result.
For each qualifying depositor: depositor_pnl_pct = all_time_pnl / (equity - all_time_pnl)
DP = average of top 5 depositors’ PnL% with ≥ 30 days, ≥ $100 equity, and ≥ 1% of TVL
Same grade thresholds as LP.
DP tells you how actual depositors are faring. If the LP is A+ but DP is D, something is wrong — perhaps the leader’s own position is different from depositors’ positions, or the commission is eating all the returns.
Look for: LP and DP that are close together. A large gap between LP and DP is a red flag.
Dates & Time
Section titled “Dates & Time”| Column | Abbr | What it shows |
|---|---|---|
| Vault Created | Created | Date the vault was first created on Hyperliquid |
| Last Updated | Updated | When the vault data was last refreshed |
| Vault Entry Time | Entry | When you first deposited (requires wallet) |
| Lockup Until | Lockup | When your deposit lockup period ends |
| Locked Until | LU | Relative time until unlock (e.g. “3 days from now”) |
| Days in Vault | Days | How many days you’ve been deposited (requires wallet) |
Identifiers
Section titled “Identifiers”| Column | Abbr | What it shows |
|---|---|---|
| Name | — | The vault’s display name |
| Description | — | Vault description set by the leader |
| Vault Address | Vault | The vault’s on-chain address (hex) |
| Leader | — | The leader’s wallet address (hex) |
| User | — | Your wallet address (requires wallet input) |
| Notes | — | Personal notes you’ve added (stored locally) |